The bond market is like the pulse of the economy
Can we read the collapse in the markets on the bond market on the yield curve? Can the bond market even give us an exact date?
It is the dream of almost every investor and economic actor to want to know what awaits the global economy in the near or far future. Of course, we do not have a magic wand for this, but there are many clues for those who can read some markets correctly.
So what are these markets? I wrote some of them on my blog. I suggest you look at the previous articles. Today, I will try to make you look at the bond market from a different perspective, which I have discussed in different analyzes before.
Bonds are actually debt securities. We can say that the bond market is also a debt market. There is interest on these debt securities. In this way, companies and governments borrow. In particular, the US government is heavily indebted.
Here is the market that we will benefit from in predicting the events that the market will encounter in the future. The fact that the US dollar is still a reserve currency used in more than half of the world’s energy trade and economic affairs ensures that the eyes turn to the decisions taken by the Fed.
Also, the decisions taken by the US government regarding the interest rates on these debt bonds are also very important. Because the interest on these debt securities issued by the US government and their relations with each other are closely related to the rest of the world’s economies.
Because the market for American bonds predicts everything in other markets?
The difference in interest rates in the bond market creates yield curves. When you think of long-term interest rates, US 10-year bond rates come to mind. Short-term interest rates are the interest rates on bonds, like quarterly on a monthly basis.
Bonds up to two years old are considered short-term. The relationship between these long-term and short-term bonds is very important.
Banks, which are kind of central to the money-making system, that is, banks that create money out of nothing and operate under the central bank and produce more than ninety percent of the money in the market, work like this: while they accept deposits with short-term interest, they give loans with long-term interest.
For example, they collect deposits with a few annual or monthly interest rates. On the other hand, they also give loans to large projects with a longer term, five, ten or twenty years. This can be big long term projects, construction projects, bridge projects etc.
In this case, if the short-term interest rates exceed the long-term, that is, the 10-year bond rates, that is, if we subtract the short-term (for example, 3-year bond rate) bond interest from the 10-year bond rate, if the result is negative, the yield curve is said to have reversed. This is a very important indicator.
Why is yield curve inversion so important?
It is important because in this case the banks get into a lot of trouble. Namely, the interest that the bank will give to the deposit in the short term, that is, the liability of the bank will be greater than the interest it will receive from the loan in the long run, that is, the values of the bank. This is a situation where the bank is in a loss.
Banks are the main money creators of the system. It is the backbone of the system. The fact that banks cannot make money when the yield curve is negative means that the backbone of the system is damaged, and if it continues like this, the system will collapse over time.
So, how long after this collapse in the markets will happen after the yield curve turns negative?
When we look at the past cycles, we see that this happened after about a year or a half.
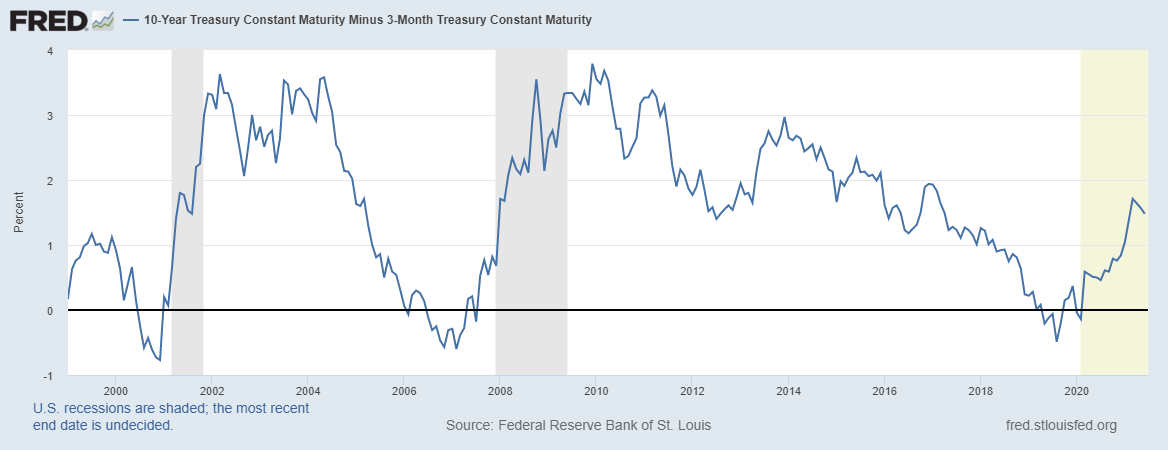
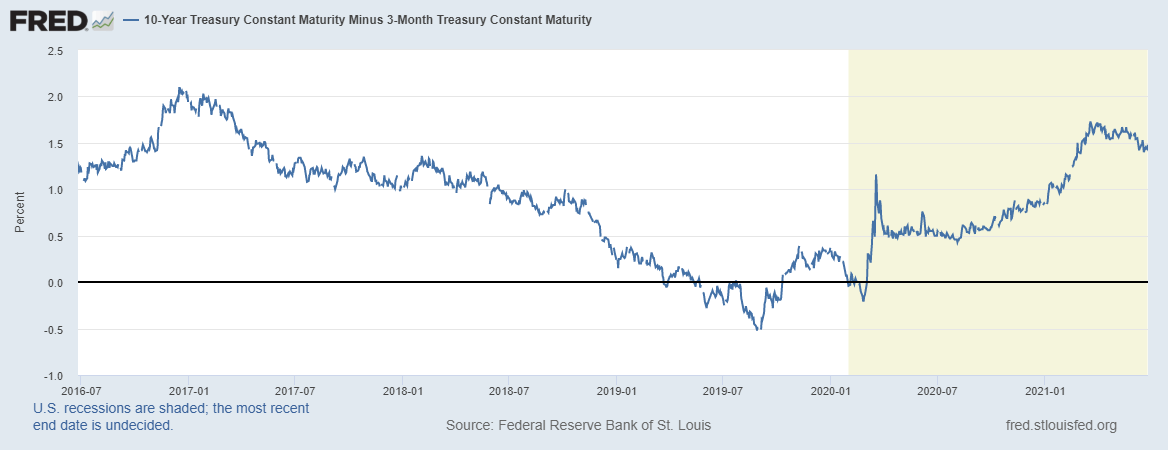
When we look at the graph, we can clearly see this. Before the 2001 and 2008 crisis, the yield curve inverted. Finally, we see it reversed in March 2019. Even at the beginning of 2020, the yield curve seems to have reversed.
The first wave of the crisis came in March 2020, nearly a year after the yield curve inverted in March 2019.
But can’t the financial market see something so precise and clearly visible?
In fact, of course, the financial market sees this, but ignores it. Even if it’s too obvious to ignore, it denies it. This is exactly where investors should pay attention to how they should approach the financial markets.
So how can the bond market be so sharply accurate in predicting the crisis?
There are large or even the largest investors in the bond market. Therefore, signals from this market are usually correct due to the magnitude of the trend.
Well, let’s say we take into account this serious indicator feature of the bond market and we see that the crisis is very close. In this situation, what position should we take so that we can meet the crisis in the right way?
In such a case, it is useful to have cash on hand. Because when the crisis erupts, prices will fall, so we have a chance to buy with the cash we have.

Source: Federal Reserve Bank of New York, DB Global research
Another indicator is a crisis indicator that the Fed calculates based on the interest rate differentials for 10-year bonds and 3-year bonds. Looking at this indicator, it is seen that before major crises such as 2001 and 2008, the indicator rose above 25 points. As of the beginning of 2021, we see that the indicator is around 27 points.
As a result, when we look at the 10-year and 3-year bond rate difference again, the probability of a crisis for the short term does not seem very high. However, it is useful to continue to follow the market closely with these indicators.