In Figure 1, we can see the 10-year bond interest rates and real GDP growth rates of the USA. If we look at the crisis years mentioned earlier, we see that the Real GDP growth rate was lower than the 10-year bond rate, especially in the 2001 crisis.
Likewise, the difference is approximately 8 points in the 2008 crisis. As of September 2020, the 10-year bond interest rate is below 1 percent and 0.68 percent, while the Real GDP growth rate is minus (-) 32 percent (https://tradingeconomics.com/united-states/indicators). High indebtedness becomes unsustainable when the economic growth rate falls below the current interest rate (https://tradingeconomics.com/united-states/indicators).
High indebtedness becomes unsustainable when the economic growth rate falls below the current interest rate. Slowing economy reduces borrowers’ ability to pay their debts, and in such a case, creditors refuse to take on interest payments on existing debt by giving more loans. The defaults increase when the burden rises so much that the economy cannot support. Moreover, the fear of default drives creditors to reduce loans.
The Fed controlled the amount of Fiat (fiduciary ) money in circulation with interest rates until 2008. In 2008, Fed lowered the interest rates to zero level and when this was not enough, started to give money to the market by purchasing bonds and bills the market. Fed named this transaction as “Quantitative Easing” (QE), not to indicate the money issuance.
Figure 1. 10-Year US Bond Rates and US Real GDP Growth Rates
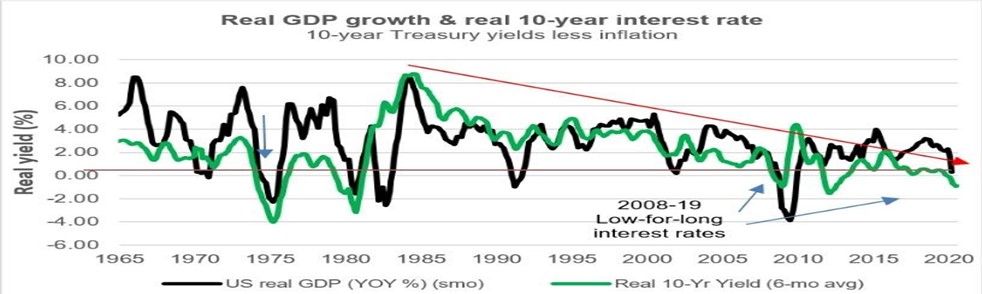
Source: www.bloomberg.com (US real GDP: US real GDP, Real 10-Yr Yield: Real 10-year return Bond)
In Figure 2, it is observed that the Fed stared to purchase the bonds linked to Real Estate Loans as much as the bonds since 2008. It was called QE 1. This was then followed by QE 2, 3 and 4 later. We can see in Figure 9 that the Fed keeps interest rates at zero, in the process called Quantitative Easing (QE) in which money was issued unlimitedly as of the 2008 crisis. Figure 10 also shows Real GDP growth rates. In crisis periods, for example, in the big oil crisis that started in the mid-1970s, we see that the US Real GDP decreased by approximately 5 percent and the Fed took measures by reducing the interest rates by 6 points. The oil crisis in 1990, the dot.com crisis in 2000, the financial crisis of 2008, and finally the major global financial crisis that we experienced the first wave in March 2020, Fed likewise reduced interest rates. Fed has diversified its monetary expansion tools with QEs after the 2008 crisis, where only the interest rate cut was not enough. The first QE, QE1 was realised in December 2008. This date is also an important date for fiat money, which has been started to be issued indefinitely. Later, other QEs were inevitable as well,since large multinational companies were already supposed to go bankrupt, with that approach ıt was tried to keep these companies alive , and thus the system was tried to be maintained.
Figure 2. The Federal Reserve’s Purchases of Bonds and Real Estate linked Bonds
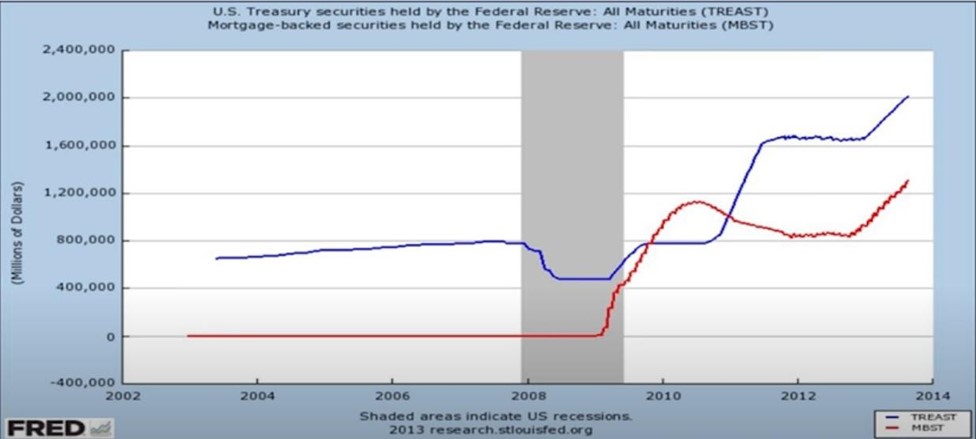
Source: https://fred.stlouisFed.org/ (US Treasury securities held by the Federal Reserve (TREAST): All Maturities: US treasury securities held by the Fed: All Maturities (TREAST), Mortgage backed securities held by the Fed: All Maturities (MBST): mortgage backed securities held by the Fed: All Maturities (MBST), shaded areas indicate US recessions: shaded areas indicate US recession, Millions of Dollars: Million Dollars)