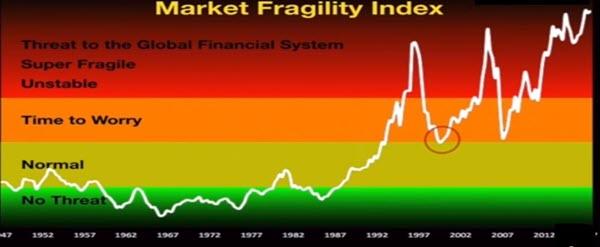
Mike Maloney blended the margin debt indicator (read: Margin Debt) with the Buffet indicator and created the “market fragility index”. While the Buffet indicator gives an idea about when the market is overvalued, the market fragility index gives information about how close it is to collapse, that is, its fragility.
These two important and explanatory indicators are combined in a single index, allowing us to see the size and weakness of the stock market bubble (Maloney, M. and J. Clark (2018). “Introducing Mike Maloney’s Market Fragility Index: What It’s Saying Now.” GoldSilver Blog.). In Figure, we can see the course of this index between 1947 and 2012.
Regarding the crisis, it is seen that the index was at the level of concern in 2000. We see that the first peak in the chart, as mentioned earlier, was in 1998, when a huge hedge fund called “Long-Term Capital Management” with $126 billion in assets went bankrupt.

Source: https://goldsilver.com/blog/introducing-the-market-fragility-index-what-its-saying-now/
This event badly affected the entire world economy. We have now surpassed the peak of 2008. The index has exceeded the threat dimension and indicates that it is heading towards a systemic collapse.