
Margin Debt, Is it useful to predict the stock market crash?
One of the most important indicators of the global crisis is the “margin debt” developed by US investor Mike Maloney.
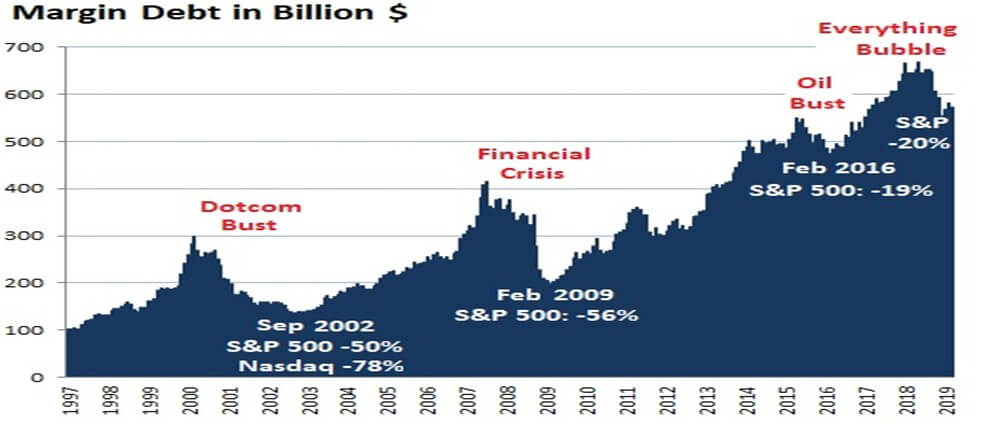
Source: FINRA
What is margin debt?
This indicator is calculated as follows: when you play on the stock market, the investment company gives you a loan and you play with this loan. For example, if you have 10 TL, they will lend you 10 TL, you play with 20 TL. The problem you get here is the risky 10 TL loan. If you win, you win with 20 TL, but if you lose, you lose 20 TL, not 10 TL. As can be seen in Figure, investors bought a large part of the amount they played in the stock market with loans (Maloney, M. and J. Clark (2018). “Introducing Mike Maloney’s Market Fragility Index: What It’s Saying Now.” GoldSilver Blog).
Can margin debt provide insight into stock market declines?
Actually, it’s hard to say for sure. However, margin debt gives a good idea of the size of the market ballooning. It also gives an idea of how fragile the markets are.
We see the margin debt value on the chart as of June 2021. The chart gives values between 1997 and 2021. If we make a simple calculation here, we will see that the ballooning has already exceeded the critical levels. Let’s look at the pre-dot.com crisis of 2001. While margin debt was around $240 billion at the end of 1998, it increased to about $460 billion just before the crisis. In other words, it increased by approximately 92 percent and the crisis started right after.
If we look before the 2008 crisis, we see that the margin debt was around 320 billion dollars at the end of 2006, and it increased to 550 billion dollars just before the crisis started. That is, it has increased by approximately seventy-two percent.
If we evaluate the situation as of June 2021, margin debt, which was at the level of 500 billion dollars at the beginning of 2020, reached a high level of 850 billion dollars as of June 2021. But is this an indication that the ballooning is critical? In a way, yes, when we look at it as a proportional increase, we see that it has increased by approximately seventy percent in a short period of one year. It is a value very close to the rate of increase experienced before the previous crises. This does not mean that a crisis will erupt tomorrow. However, this is a very serious warning of how ballooning and fragile the markets have become.