Observation period: 24 September – 24 October 2026
In January 2026, silver broke through $50 per ounce for the first time in 45 years. Before the month was out, on 29 January, it touched an all-time high of about $121.67. Then it fell back, and by late October it was trading in the mid-$50s. Most observers filed this under commodity noise. I think they missed the larger picture.
The world is building the most electricity-hungry technology in its history, and a growing share of the bill is being paid with borrowed money. That technology depends on a metal the world has been short of for six consecutive years. The debt is being counted carefully. The ounces are not.
The Machine That Runs on Borrowed Time
\nStart with the spending. In 2026, the five largest infrastructure builders — Amazon, Alphabet, Microsoft, Meta and Oracle — are on course to spend between $660 billion and $800 billion on capital projects, most of it for artificial intelligence (Futurum Research; AL Capital). Amazon alone is tracking near $220 billion and Alphabet near $200 billion.\n\nMore and more of it is borrowed. According to HB Capital (October 2026), debt financed roughly 9 percent of hyperscaler capital expenditure in 2024 and around 32 percent by mid-2026. The same research finds that, around the third quarter of 2026, the group’s combined capital spending overtook its combined operating cash flow — a break from years in which these companies funded expansion from internal cash.\n\nThe International Monetary Fund has noticed. Its October 2026 Global Financial Stability Report placed a sharp correction in AI-linked assets among the three main risks to the financial system, alongside higher sovereign bond yields and cyber threats. As reported in coverage of the report, the IMF described a ‘circular’ financing structure: roughly $300 billion of equity and $650 billion of debt tied to some $1.4 trillion of revenue commitments that have not yet been earned. On the other side of the ledger, the combined annualized revenue of the two leading model developers, OpenAI and Anthropic, is expected to pass $25 billion by the end of 2026 (Futurum). Set that against an annual build-out bill in the hundreds of billions, and the gap is plain.\n\nI have written before about how the world’s debt wall is being refinanced at much higher rates (The $18 Trillion Rollover). The corporate AI boom is now adding its own layer to that wall. What the financial-stability debate has largely left out is the physical side: what this build-out is made of, and how scarce those inputs already are.\n
Why Silver? The Quiet Conductor
\nPhysically, artificial intelligence is an electrical problem, and this is where silver comes in. It has the highest electrical and thermal conductivity of any metal. It is used in the switchgear and circuit breakers that distribute power, in contacts and connectors, and in a wide range of electronic components. In consumer gadgets, manufacturers cut silver content to save money. In critical power and computing equipment, reliability usually matters far more than the cost of the metal.\n\nThe electricity demand behind all this is rising fast. The International Energy Agency estimates that global data-centre electricity use will grow from about 485 terawatt-hours in 2025 to around 945 terawatt-hours by 2030, nearly doubling in five years (Chart 2). Some industry analysts go further and project that data centres could account for more than a tenth of electrical and electronics silver demand by 2027 (Golden Star, 2026). That is a single-source estimate, and I treat it as an indication rather than a fact.\n\nChart 2. Global data-centre electricity consumption (TWh). Source: International Energy Agency, Energy and AI.\n\n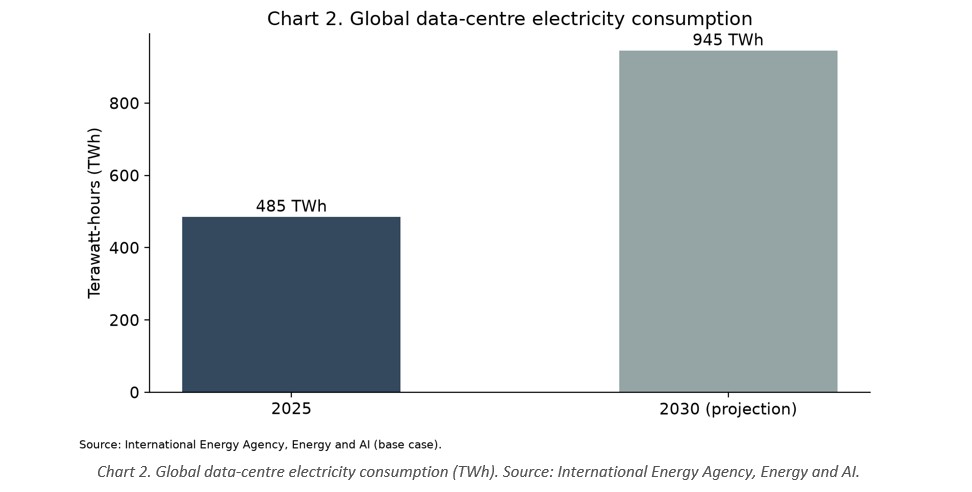 \n\nWashington has also changed how it sees the metal. In November 2025, the US Department of the Interior added silver to its list of critical minerals. The United States relied on imports for about 64 percent of its silver consumption in 2024 (US Geological Survey).\n
Six Years of Taking Without Giving Back
\nAccording to the Silver Institute and its research partner Metals Focus, the silver market has been in deficit every year since 2021. In other words, total demand has exceeded total supply from mines and recycling for six straight years, and the gap has been filled from above-ground stocks.\n\nTable 1 — Annual Global Silver Market Deficit, 2021–2026F\n
\n\n\n\n\n\n\n\n\n\n\n\n\n\n\n\n\n\n\n\n\n\n\n\n\n\n\n\n\n\n\n\n\n\n\n\n\n\n\n\n
| Year | Market deficit (Moz) | Cumulative deficit, as reported (Moz) |
| 2021 | 81 | — |
| 2022 | 253 | — |
| 2023 | ~140 | 474 (2021–2023) |
| 2024 | 148.9 | 678 (2021–2024) |
| 2025 | 40.3 | — |
| 2026F | 46.3 | 762.1 (2021–2026F) |
\nSources: Silver Institute / Metals Focus, World Silver Survey and Interim 2026 updates, via secondary reporting. Moz = million troy ounces; F = forecast. The 2023 figure is implied from the reported 2021–2023 total. Cumulative figures are shown only where the source publishes them; they include revisions to earlier years, so they do not add up exactly to the annual numbers.\n\nChart 1. Annual global silver market deficit (Moz). Source: Silver Institute / Metals Focus.\n\n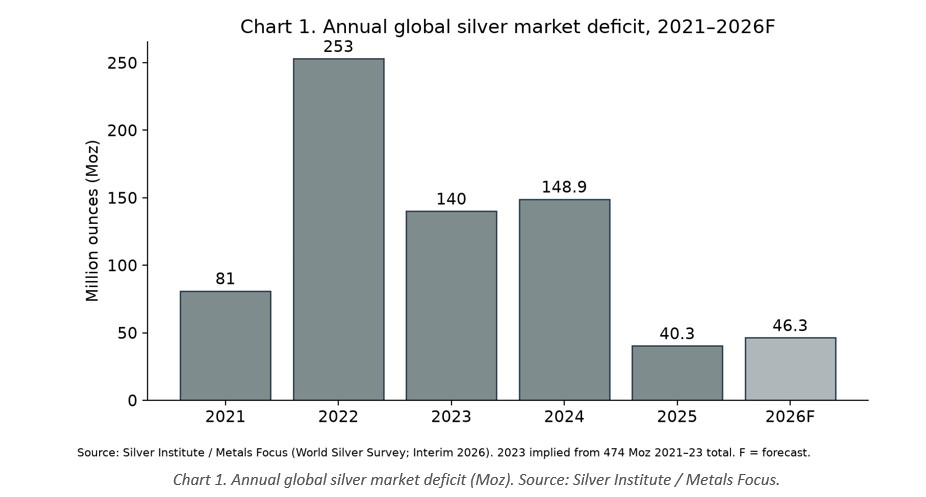 \n\nThe smaller deficits of 2025 and 2026 do not mean supply has recovered. They mostly reflect demand pulling back at record prices. Solar manufacturers have cut how much silver they use per panel, and silver demand from solar is expected to fall to about 151 million ounces in 2026, down roughly 19 percent. Demand from electrical and electronics uses is forecast at 422.9 million ounces, down about 6 percent.\n\nSupply is slow to respond for a structural reason. About 73.9 percent of the world’s silver comes out of the ground as a byproduct of mining lead, zinc, copper and gold. Whether a mine digs more depends mainly on the economics of those other metals, not on the silver price. And according to the Silver Institute, it takes on average 15.7 years for a new silver discovery to reach production.\n\nRecycling has helped, reaching a 12-year high of 197.6 million ounces in 2025, but it has not closed the gap. The Silver Institute estimates the cumulative deficit for 2021–2024 alone at 678 million ounces, or roughly ten months of global mine supply. With the 2025 shortfall and the 2026 forecast added, the reported total comes to about 762 million ounces.\n
The Pricing Paradox
\nGold hit an all-time high of about $5,608 per ounce in January 2026, driven by central-bank buying and a broad loss of trust in paper assets. I examined that shift in The 45% Threshold. By 23 October 2026, gold had fallen to $3,993.96 (Trading Economics), its lowest level since mid-July, though still high by any historical standard.\n\nSilver has fallen harder. In early October, the gold-to-silver ratio — how many ounces of silver buy one ounce of gold — stood at about 69. By late October, as silver slid from above $60 to around $54, the ratio had risen above 74 (USAGold; goldprice.org).\n\nThe reason is that markets still price silver mainly as an industrial input. Central banks hold gold, not silver. Investment flows into silver are irregular. The safe-haven system that supports gold has never been built for silver.\n\nSo the anomaly is this. The metal is in a multi-year physical deficit, hard to replace in the power systems the AI economy relies on, and newly classed as critical by the world’s largest economy. Yet in a correction it is priced as though none of that were true.\n
The Collision Course
\nTable 2 — Two Timelines Converging on the Same Constraint\n
\n\n\n\n\n\n\n\n\n\n\n\n\n\n\n\n\n\n\n\n\n\n\n\n\n\n\n\n\n\n\n\n\n\n\n
| Factor | AI infrastructure | Silver supply |
| 2026 scale | $660–800B capex (top 5) | 46.3 Moz deficit (2026F) |
| Financing / stock strain | Debt ≈ 32% of capex (mid-2026) | ~762 Moz cumulative deficit (2021–2026F) |
| Income vs. outlay | >$25B AI-developer revenue vs. hundreds of billions in capex | Recycling 197.6 Moz (2025) — not enough |
| Speed of supply response | Constrained by grid connections | 15.7 years, discovery to production |
| Physical bottleneck | Over half of planned 2026–28 AI servers may lack power infrastructure (Deloitte) | 73.9% of supply is byproduct |
\nSources: Futurum Research; HB Capital (October 2026); Deloitte Weekly Global Economic Update (22 October 2026); Silver Institute / Metals Focus.\n\nFrom these two timelines, three scenarios follow. They are analytical possibilities, not forecasts.\n\nScenario A — Gradual tightening. The build-out continues at roughly its current pace. Silver demand from power and data infrastructure grows steadily, inventories keep shrinking, and prices move to a higher range over two to three years.\n\nScenario B — The grid becomes the brake. Power, not money, becomes the binding constraint. Industry reports say Oracle has issued a force-majeure notice over power delays at its New Mexico data-centre site, and Deloitte warns that much of the planned server capacity may not have the electrical infrastructure it needs. AI deployment slows, industrial silver demand grows more slowly, but the deficit does not go away, because the grid upgrades themselves use silver-bearing equipment.\n\nScenario C — The debt correction. The scenario the IMF has flagged comes to pass: AI revenue disappoints, equity values fall, and debt becomes harder to service. Hyperscaler capex is cut sharply and industrial silver demand weakens. In this case, silver’s price depends less on factories and more on whether investors once again treat it as a monetary metal alongside gold, as they have in past periods of financial stress.\n\nEach is a branch of the same tree, and the trunk is already visible in the data.\n
The Verdict
\nHere is what the evidence shows. The silver market has been in deficit for six consecutive years. The AI build-out is now spending more than its builders earn from operations, and debt is filling the gap. The grid that must power that build-out is made of equipment that needs silver, a metal whose new supply takes, on average, more than fifteen years to bring on stream.\n\nMy interpretation is that markets are pricing these two stories separately when they belong together. In October 2026, the IMF counted the debt. As far as I can see, no one in official circles has yet counted the ounces.\n
Glossary of Key Terms
Structural Deficit: When demand for a commodity exceeds supply year after year because of built-in imbalances, not a one-off disruption.
Byproduct Mining: When a metal is recovered as a side product of mining something else. About 74 percent of silver comes from lead, zinc, copper and gold mines, so a higher silver price does not, on its own, make miners produce much more silver.
Gold-to-Silver Ratio: The number of ounces of silver needed to buy one ounce of gold. In October 2026 it rose from about 69 to above 74, which means silver became cheaper relative to gold.
Hyperscaler: A company that runs computing infrastructure at enormous scale, such as Amazon Web Services, Google Cloud or Microsoft Azure. A handful of them account for most of the world’s AI infrastructure spending.
Capital Expenditure (Capex): Money spent on long-term physical assets such as data centres, power systems and chips. When capex exceeds the cash a company generates from operations, the difference has to be borrowed or raised.
Force Majeure: A contract clause that suspends obligations when extraordinary events beyond a party’s control occur. When a data-centre builder invokes it over power delays, physical limits, not just financial ones, are starting to bind.
Analytical Note: Facts (sourced figures), interpretation and scenarios (possible paths, not forecasts) are kept separate. Silver Institute cumulative deficits differ slightly from the sum of annual figures because of revisions; only published totals are shown, and the 2023 figure is implied from the 2021–2023 total. The data-centre share of silver demand by 2027 is a single-source estimate. The IMF financing figures are as reported in coverage of the October 2026 GFSR, and the Oracle notice comes from industry reporting. Figures I could not verify against a primary source, including per-facility silver use, long-run gold-to-silver ratio averages and data-centre construction timelines, were excluded.
Sources: Silver Institute / Metals Focus, World Silver Survey and Interim 2026 updates (silverinstitute.org) | International Monetary Fund, Global Financial Stability Report, October 2026 (imf.org) | International Energy Agency, Energy and AI (iea.org) | HB Capital, Data Centers Q3 2026 (hbcapitalre.com) | Broadband Breakfast, October 2026 (broadbandbreakfast.com) | Futurum Research, hyperscaler capex 2026 (futurumgroup.com) | Deloitte, Weekly Global Economic Update, 22 October 2026 (deloitte.com) | US Department of the Interior / US Geological Survey, critical minerals list and Mineral Commodity Summaries (usgs.gov) | Trading Economics, gold, 23 October 2026 (tradingeconomics.com) | USAGold and goldprice.org, gold and silver prices, October 2026 | Golden Star, silver demand analysis, 2026 (goldenstar.org.uk)