
A fuel shortage, a rate hike, and a bond market that is starting to feel both at the same time.
On 9 September 2026, a barrel of North Sea crude cost $113.48. One month earlier, it averaged $91. A week later, the average American paid $6.29 for a gallon of diesel — the highest retail price since the series began in 1994. And on 16 September, the European Central Bank raised interest rates, not because the economy was booming, but because energy was burning through the inflation target.
This is not a story about oil. It is a story about what oil does to everything else — and about the moment when a fuel shortage meets the world’s funding problem.
The fuel that moves everything
Diesel is the fuel of the real economy. Trucks, tractors, ships, generators, farm machinery, heating systems — most of the world’s physical work runs on it. When diesel gets expensive, the price of everything that moves gets expensive.
The chain is short. Freight costs make up 20 to 40 percent of food prices. Natural gas is a critical input for fertilizer production. When food and fuel prices rise, workers ask for higher wages. When wages rise, services get more expensive. That is how a fuel shortage becomes an inflation problem.
This is not a prediction. It is a mechanism — and the data from the last month shows the mechanism is already running. The first signs were visible even before this window: US producer prices posted their largest annual increase in three and a half years in June 2026, with trucking costs up 3.4 percent. When the cost of moving goods rises, it shows up in producer prices before it reaches the shop shelf.
The numbers behind the squeeze
The International Energy Agency’s Oil Market Report of 11 September 2026 describes the largest supply disruption in the history of the global oil market. More than 10 million barrels per day of Gulf production capacity is offline. Global production fell by 1.6 million barrels per day in August, to 100.1 million.
The IEA now expects 2026 supply of 100.7 million barrels per day — down 5.7 million from last year — and demand down 2.5 million. The demand loss is concentrated in the products the world needs most: middle distillates like diesel, and petrochemical feedstocks.
The stock picture is just as tight. Observed global oil stocks fell by 95 million barrels in August alone. Since February, cumulative draws total 507 million barrels — an average of 2.8 million barrels per day.
The map behind the squeeze matters as much as the numbers. The IEA calls the closure of the Strait of Hormuz the largest supply disruption in the history of the oil market. In March 2026, IEA member countries released 400 million barrels from emergency stocks in a coordinated action — unprecedented in scale. Diesel exports from the Gulf and Russia are constrained, and sanctions shape who can buy what. This is not a normal supply cycle. It is a geopolitical event with a price tag.
Refineries are running at 81.4 million barrels per day, 4.2 million below last year. US distillate stocks are 13 percent below their five-year seasonal average, and refineries run at 97 percent capacity. There is very little slack left.
Figure 1. US diesel retail prices by region, week of 14 September 2026 ($/gallon)
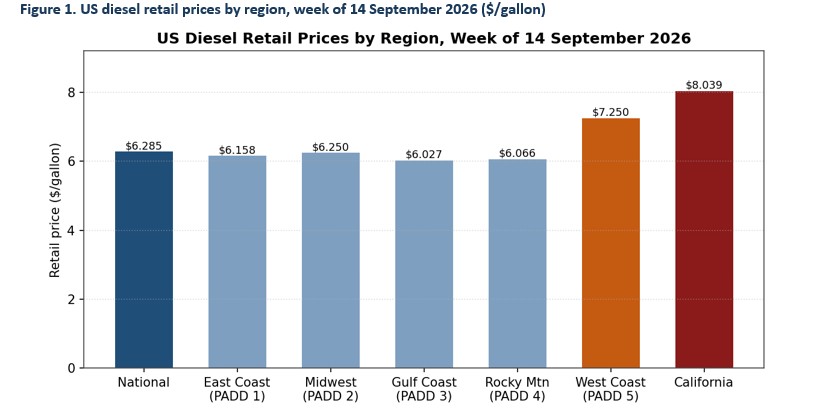
Source: U.S. Energy Information Administration (EIA), Weekly Retail Gasoline and Diesel Prices, week of 14 September 2026.
Table 1. Energy–Inflation–Funding: Key Indicators, September 2026
| Indicator | Value | Date | Source |
| North Sea Dated crude (monthly average) | $91.00/barrel | August 2026 | IEA OMR |
| North Sea Dated crude (spot) | $113.48/barrel | 9 Sep 2026 | IEA OMR |
| US diesel retail (national average) | $6.285/gallon | week of 14 Sep 2026 | EIA |
| Euro area HICP (annual) | 3.2% | August 2026 | Eurostat |
| Euro area energy HICP (annual) | 14.3% | August 2026 | Eurostat |
| ECB deposit facility rate | 2.50% | effective 16 Sep 2026 | ECB |
| ECB 2026 HICP projection | 3.0% | Sep 2026 | ECB |
| EUR/USD (ECB reference rate) | 1.1460 | 18 Sep 2026 | ECB |
| US 2-year Treasury yield | 4.76% | 18 Sep 2026 | US Treasury |
| US 10-year Treasury yield | 5.01% | 18 Sep 2026 | US Treasury |
| US 30-year Treasury yield | 5.34% | 18 Sep 2026 | US Treasury |
| NY Fed 1-year inflation expectation | 3.6% | Aug 2026 SCE | NY Fed |
Sources: IEA Oil Market Report (11 Sep 2026); EIA Weekly Retail Diesel Prices (week of 14 Sep 2026); Eurostat HICP (17 Sep 2026); ECB monetary policy decision and reference rates; U.S. Treasury Daily Par Yield Curve Rates; Federal Reserve Bank of New York SCE (Aug 2026).
Inflation wears an energy label
The euro area’s annual inflation rose to 3.2 percent in August 2026, from 2.9 percent in July. The energy component jumped to 14.3 percent, from 10.3 percent. Energy alone contributed 1.29 percentage points of the 3.2-point total.
Services inflation held at 3.0 percent. That is the sticky part — the part that comes from wages and demand, not from oil. The energy shock is now visibly passing into the price level, and the price level is what central banks watch.
Figure 2. Euro area HICP main components, July vs August 2026 (annual % change)
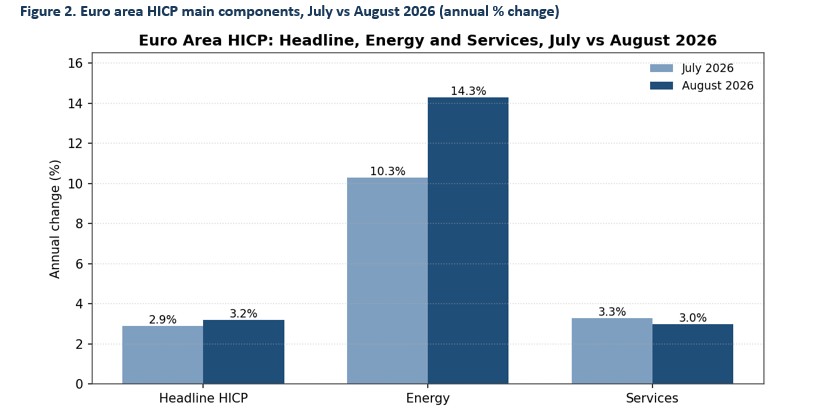 Source: Eurostat, prc_hicp_minr (EA21, base year 2025=100), published 17 September 2026.
Table 2. Euro Area HICP Main Components, July and August 2026
| Component | Jul 2026 annual (%) | Aug 2026 annual (%) | Aug 2026 monthly (%) | Aug 2026 contribution (pp) |
| Energy | 10.3 | 14.3 | 2.9 | +1.29 |
| Services | 3.3 | 3.0 | 0.0 | +1.43 |
| Non-energy industrial goods | — | 1.2 | 0.6 | +0.30 |
| Food, alcohol and tobacco | — | 1.1 | 0.0 | +0.22 |
| Headline HICP | 2.9 | 3.2 | 0.4 | — |
Source: Eurostat, prc_hicp_minr (EA21, base year 2025=100), published 17 September 2026.
The central bank dilemma
On 10 September 2026, the ECB raised its three key rates by 25 basis points, effective 16 September. The deposit facility now pays 2.50 percent. The reason given was persistent inflation pressure from the Middle East conflict.
The ECB’s September projections see euro area inflation at 3.0 percent in 2026, 2.5 percent in 2027, and 2.1 percent in 2028. Growth is projected at 0.9 percent this year. The ECB expects second-round effects to remain more limited than in 2021–2024, citing weak demand, a stronger euro, and import competition from China.
The timing makes it harder. This energy shock arrives at a moment when the dollar-based monetary architecture is already under structural pressure. Central banks have been diversifying reserves toward gold; IMF and BIS research notes that gold carries no counterparty risk and looks attractive when sanctions and geopolitical risk rise — while warning that it is not a risk-free reserve asset. The funding stress of 2026 is therefore not just a test of one central bank’s policy. It is a test of the system that prices the world’s debt.
Here is the dilemma in one sentence. The world needs high interest rates to tame energy inflation. The world also needs low interest rates to fund its debts. It cannot have both at the same price.
The funding problem
The bond market is where the two pressures meet. On 18 September 2026, the US 2-year yield stood at 4.76 percent, the 10-year at 5.01 percent, and the 30-year at 5.34 percent. During September, the 2-year yield rose about 37 basis points while the 10-year rose about 22. The 2-year–10-year spread narrowed from +40 basis points to +25.
That shape matters. When short-term yields rise faster than long-term yields, the market is saying: the central bank will keep rates high for a while. When long-term yields stay high, the market is saying: the government will have to pay more to borrow for a long time. Both messages are visible in the curve right now.
Figure 3. US Treasury yields — 2-year, 10-year and 30-year, September 2026 (%)
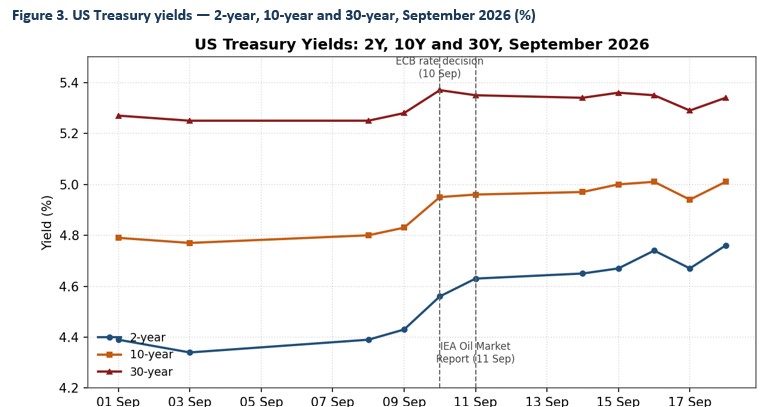 Source: U.S. Department of the Treasury, Daily Treasury Par Yield Curve Rates, September 2026.
The structural backdrop deserves attention too. Federal Reserve research shows that large hedge funds held about $4.0 trillion of gross US Treasury exposure as of September 2025, with roughly $830 billion in the cash-futures basis trade — about twice the previous peak of early 2020. These are 2025 figures, not current data — the plumbing in place before this shock arrived. When funding conditions tighten, that plumbing is tested.
The auction calendar shows the scale of the test. The US Treasury sold a 10-year note on 9 September and a 30-year bond on 10 September, in the middle of the energy spike. The Treasury itself notes that the 10-year yield remains well below its cyclical peak and that US Treasuries have been the best-performing G10 market — a reminder that, so far, the world still wants the asset. The question is at what price.
What to watch
Three scenarios are on the table. None is a forecast; each is a path to watch.
Base case. The energy squeeze eases, second-round effects stay limited, and bond markets keep functioning. Inflation drifts back toward target in 2027–2028.
Adverse case. Diesel and freight costs pass into core goods and services. Central banks stay restrictive while growth weakens. The long end of the bond market demands a higher funding premium. This is the case where the diesel yield curve gets its name: the fuel shortage and the funding problem pull in the same direction.
Reverse case. High energy prices destroy demand faster than they raise prices. Inflation pressure gives way to growth loss. The IEA’s negative 2026 demand forecast — a 2.5 million barrel per day drop — is a reminder that this path exists. It would not be the first time an oil shock ended in recession rather than inflation.
Watch the concrete indicators: Treasury yields and the 2-year–10-year spread, repo rates, auction results, inflation expectations. The New York Fed’s August survey put one-year inflation expectations at 3.6 percent, with gasoline price expectations jumping 1.7 points to 4.6 percent. Expectations are the bridge between a fuel shock and a wage spiral. Watch that bridge.
The diesel yield curve is the meeting point of two pressures. The world wants low rates to fund its debts and high rates to tame energy inflation. It cannot have both at the same price. The market is starting to choose — and the choice shows up in the yield curve.
No one knows yet which scenario wins. What the data shows is that the mechanism is real, the timing is now, and the stakes are the price of money itself. When the fuel that moves everything gets expensive, the money that funds everything gets expensive too. That is the quiet story of September 2026 — and it is not over.
Glossary
Basis trade: A trade where an investor buys a Treasury bond and sells a futures contract on it, earning a small difference. Usually safe — until funding costs jump.
Basis point (bp): One hundredth of one percent. 25 basis points = 0.25 percent.
Crack spread: The difference between the price of crude oil and the price of products made from it, like diesel. A wide spread means refiners earn more.
Diesel: The fuel used by trucks, ships, tractors and generators. It is the workhorse fuel of the world economy.
Distillate stocks: Stored supplies of diesel and heating oil. Low stocks mean less cushion if something goes wrong.
HICP: The Harmonised Index of Consumer Prices — the official measure of inflation used across the euro area.
Middle distillates: Refined oil products in the middle of the boiling range — mainly diesel and jet fuel.
Repo: A short-term loan where a bond is used as collateral. Repo markets are how banks and funds borrow cash overnight.
Second-round effects: When a one-time price jump (like oil) turns into ongoing inflation, because workers demand higher wages and firms raise prices to cover them.
Yield curve: A line showing the interest rates governments pay to borrow for different lengths of time. A flat or inverted curve often signals trouble ahead.
Sources
- International Energy Agency, Oil Market Report, 11 September 2026 — iea.org/reports/oil-market-report-september-2026
- Eurostat, Euro area inflation (HICP), August 2026, published 17 September 2026 — ec.europa.eu/eurostat (prc_hicp_minr)
- European Central Bank, Monetary policy decision, 10 September 2026 (effective 16 September 2026) — ecb.europa.eu/press/pr/date/2026/html/ecb.mp260910
- European Central Bank, Euro area staff macroeconomic projections, September 2026 — ecb.europa.eu/press/projections
- European Central Bank, Euro foreign exchange reference rates, 18 September 2026 — ecb.europa.eu/stats/policy_and_exchange_rates
- US Department of the Treasury, Daily Treasury Par Yield Curve Rates, September 2026 — home.treasury.gov
- US Energy Information Administration, Weekly retail diesel prices, week of 14 September 2026 — eia.gov
- Federal Reserve, FEDS Notes, “Decomposing Hedge Funds’ U.S. Treasury Exposures,” 22 June 2026 (data as of September 2025) — federalreserve.gov
- Federal Reserve Bank of New York, Survey of Consumer Expectations, August 2026 — newyorkfed.org