
What two market valuation measures—and one that actually prices risk—say about where we stand
Arzu Alvan | October 10, 2026
There is a number that should stop you for a moment.
On October 9, 2026, the Shiller CAPE ratio for the S&P 500 stood at 41.87. In 145 years of recorded data, that number has been higher exactly once: in December 1999, at the height of the dot-com bubble.
This is not a prediction. It is a data point. But it is worth sitting with.
Table 1 — Shiller CAPE by Decade, 1996–October 2026
| Period | CAPE: decade avg. | CAPE: decade high | Key credit market event |
| 1996–2005 | 31.5 | 43.8 (Jan 2000) | HY spread peaked at 1,107 bps (Oct 2002) |
| 2006–2015 | 23.1 | 27.2 (Jan 2007) | HY spread peaked at 2,182 bps (Dec 2008); troughed at 241 bps (Jun 2007) |
| 2016–Oct 2026* | 32.3* | 41.9 (Oct 2026) | HY spread at 315 bps (Oct 2026); COVID spike 1,087 bps (Mar 2020) |
*Partial period: January 2016 – October 2026. Average includes all January 1 readings plus the October 9, 2026 reading.
Sources: Shiller CAPE — multpl.com (Robert Shiller data); HY spreads — ICE BofA US High Yield Index OAS, FRED (BAMLH0A0HYM2).
Two Gauges, One Story
The Shiller CAPE — Cyclically Adjusted Price-to-Earnings ratio — divides the S&P 500 price by the average of the previous ten years of inflation-adjusted corporate earnings. The ten-year average smooths out the business cycle: one bad year or one great year doesn’t distort the reading. It is designed to answer a simple question. Are stocks expensive compared to the actual earning power of the companies behind the index?
At 41.87, the current reading is 2.4 times the long-run mean of 17.4 and 2.6 times the long-run median of 16.1 (multpl.com, sourced from Robert Shiller, Oct 2026). When has CAPE been this high? Only in the lead-up to and peak of the dot-com bubble, from roughly 1997 through early 2002. Every other period in 145 years of recorded US market history showed a lower reading.
The second gauge tells a similar story through a different lens.
The Buffett Indicator — total US stock market capitalization divided by GDP — was named after Warren Buffett described it in a 2001 Fortune essay as “probably the best single measure of where valuations stand at any given moment.” The idea is straightforward: the stock market prices expected future economic output. When market value outpaces GDP by a wide margin for a sustained period, either corporate earnings need to grow sharply to justify the premium — or prices need to fall.
As of September 2026, the indicator stood at approximately 195% of GDP (GuruFocus). One alternative calculation — using Wilshire 5000 market capitalization and Atlanta Fed GDP estimates — puts it at 244% as of June 30, 2026 (currentmarketvaluation.com). The difference comes from how each source measures total market capitalization, not from any dispute about GDP. Both figures sit at historically elevated levels. By comparison, the ratio peaked at roughly 140–160% at the height of the dot-com bubble and at about 105–118% before the 2008 financial crisis.
Neither CAPE nor the Buffett Indicator tells us when. They only tell us how expensive.
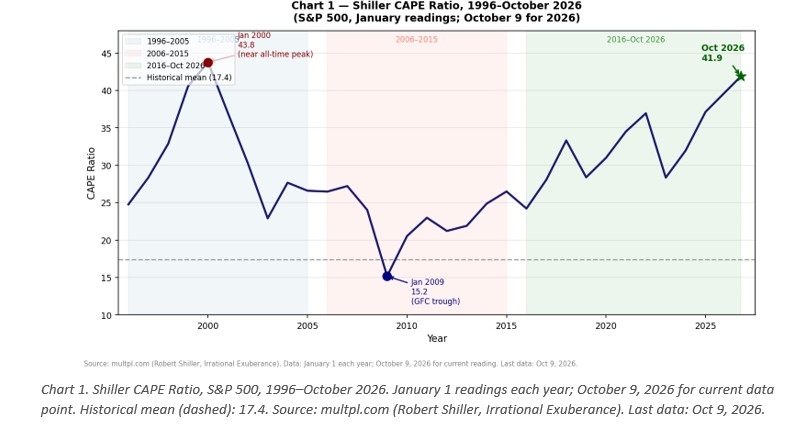
Chart 1. Shiller CAPE Ratio, S&P 500, 1996–October 2026. January 1 readings each year; October 9, 2026 for current data point. Historical mean (dashed): 17.4. Source: multpl.com (Robert Shiller, Irrational Exuberance). Last data: Oct 9, 2026.
The Signal the Equity Gauges Can’t Give
Here is where the story gets more interesting.
If you look away from equity valuations and toward the credit market, the picture changes — not in the direction you might expect.
High-yield corporate bonds — sometimes called junk bonds — are issued by companies that banks and rating agencies consider riskier than average. These companies pay a higher interest rate to borrow, and the spread between their borrowing rate and the US government’s borrowing rate tells you how much extra risk investors think they are taking on.
When credit spreads are wide, investors are worried. When they are tight, investors are calm.
As of October 8, 2026, the ICE BofA US High Yield Index spread stood at 315 basis points — 3.15 percentage points above Treasury yields (Federal Reserve Bank of St. Louis, FRED, series BAMLH0A0HYM2). The long-run average for this measure, going back to 2000, is approximately 500 basis points. In June 2007 — one year before the financial crisis peaked — the spread had fallen to 241 basis points, an all-time record low at that point.
The current reading of 315 basis points is tight. Not 2007-tight. But tighter than average. The credit market, right now, is not pricing in widespread financial stress.
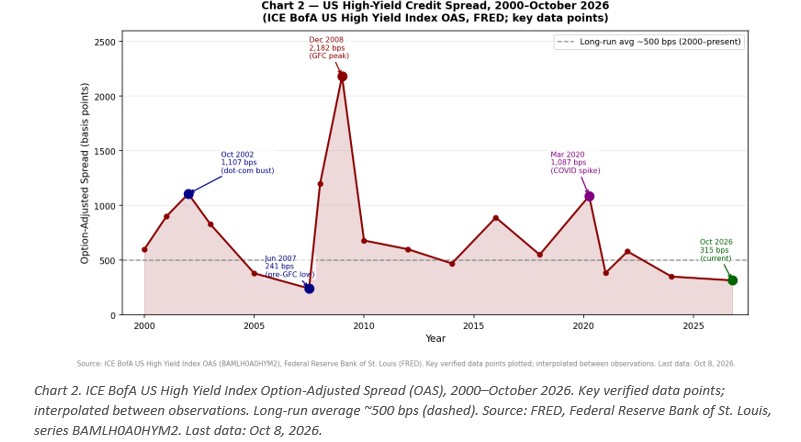
Chart 2. ICE BofA US High Yield Index Option-Adjusted Spread (OAS), 2000–October 2026. Key verified data points; interpolated between observations. Long-run average ~500 bps (dashed). Source: FRED, Federal Reserve Bank of St. Louis, series BAMLH0A0HYM2. Last data: Oct 8, 2026.
This divergence — historically expensive equity markets, historically calm credit markets — has a precedent. In 2006 and 2007, the CAPE was elevated, credit spreads hit their lowest point on record, and stock markets kept rising. Then the housing market cracked. Banks that had packaged and sold mortgage risk couldn’t find buyers. Credit spreads went from calm to catastrophe in under eighteen months.
That is not a prediction for today. It is a reminder of the mechanism.
What These Indicators Don’t Do
A high CAPE does not predict a crash. It predicts lower returns. Research by Robert Shiller and others shows that a high starting CAPE is associated with lower average real returns over the following ten years — not with a specific event on a specific date.
A high Buffett Indicator doesn’t trigger a recession. The increasing share of global revenues for US companies, the dominance of capital-light technology businesses, and structural changes in corporate profitability all offer legitimate reasons why the ratio may sit higher today than in prior decades. The indicator’s critics make a fair point. The indicator’s defenders make a fair point too.
And a tight credit spread can mean genuine financial soundness — or it can mean investors have grown complacent.
The question worth asking is not “will there be a crisis?” It is: what would need to change for the current setup to become unstable?
Three Scenarios
If current conditions ease: The Fed eases further, corporate earnings grow into current valuations, credit spreads stay calm. Equity prices could remain expensive for years — as they did from 1996 through 1999 — without a crisis. A soft normalization is a plausible outcome.
If a correction happens but stays contained: Stock prices fall 20–30%, the CAPE drops toward 28–30, and credit spreads widen modestly. This would be a market correction, not a financial crisis — unpleasant for investors but not economically destabilizing. Watch for: rising unemployment claims, declining corporate revenue guidance, and high-yield spreads pushing past 500 basis points.
If vulnerabilities compound: A shock — financial, geopolitical, or macroeconomic — arrives when credit spreads are tight and balance sheets are extended. Markets priced for calm carry no buffer. The warning signal, as in 2007, would likely come from the credit market first: a sudden, sustained widening of high-yield spreads to above 600–700 basis points.
The One Number to Watch
Of all the indicators covered here, the high-yield credit spread deserves the most attention right now. Equity valuation measures tell you the market is expensive. They don’t tell you when expensive becomes dangerous. Credit spreads translate valuation risk into price risk.
At 315 basis points, the credit market is saying: we are not worried yet.
That is useful information. It is not a green light.
Glossary
CAPE (Shiller PE): The stock market price divided by the average of ten years of inflation-adjusted earnings. Designed to smooth out business cycle swings. Think of it as asking: relative to what companies actually earn over a full decade, how much are you paying today?
Buffett Indicator: Total stock market value divided by GDP. A gauge of whether the market has grown faster than the underlying economy. Higher values suggest the market is pricing in expectations well beyond current economic output.
Credit spread: The extra interest rate a riskier borrower pays compared to a government borrower. Like the extra premium a first-time driver pays on car insurance. Wide spreads = lenders pricing in more risk; narrow spreads = lenders feel comfortable.
High-yield bond: A corporate bond rated below investment grade. Higher default risk means higher interest rates to attract lenders. Also called a junk bond.
Basis point: One hundredth of a percentage point. 315 basis points = 3.15%.
ECY (Excess CAPE Yield): The CAPE earnings yield (1/CAPE) minus the real 10-year Treasury yield. Measures the extra return investors expect from stocks over bonds, after inflation. Currently near 1% versus a historical median of 3.3%.
Sources
- Shiller CAPE historical data: multpl.com, sourced from Robert Shiller, Irrational Exuberance. https://www.multpl.com/shiller-pe/table/by-year (accessed Oct 2026).
- Buffett Indicator (Wilshire 5000 basis): currentmarketvaluation.com, data as of June 30, 2026. https://www.currentmarketvaluation.com/models/buffett-indicator.php
- Buffett Indicator (GuruFocus basis): gurufocus.com, data as of September 2026. https://i.ytimg.com/vi/GiDBBIpjngQ/maxresdefault.jpg
- ICE BofA US High Yield Index OAS (BAMLH0A0HYM2): Federal Reserve Bank of St. Louis, FRED. https://fred.stlouisfed.org/series/BAMLH0A0HYM2 (accessed Oct 2026).
- Shiller Excess CAPE Yield (ECY): macromicro.me, September–October 2026. https://cdn.macromicro.me/discuss/b82ac74a-1107927.png
- Warren Buffett, “Warren Buffett on the Stock Market,” Fortune, December 2001.
- Robert Shiller, Laurence Black & Farrukh Jivraj, “Making Sense of Cape,” Journal of Portfolio Management, 2020.
- Institute of International Finance, Global Debt Monitor, February 2025. https://www.iif.com