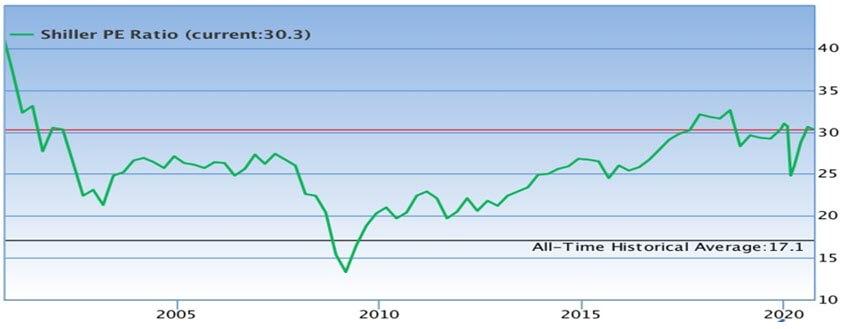
One of the most important indicators that show the bubble in the stock market is the “Shiller P / E Ratio”, ie the price / earnings (also known as the CAPE ratio) used in the stock markets developed by Professor Shiller. This ratio was developed by Yale University professor Robert Shiller, who won the Nobel Prize in Economics in 2013.
Shiller emphasized that there was a ballooning with the overvaluation in the US stock market in the late 1990s and this was an important warning for the crisis. The P / E ratio is calculated as follows: The annual earnings per share (EPS) of a stock index such as S&P 500 in the last 10 years are taken and these earnings are realized according to the CPI. The 10-year average of the newly acquired values is taken and the current level of the S&P 500 is divided by this 10-year average. In fact, here we are calculating the ratio between the company’s stock market value and the money it actually makes (Campbell, J. Y. and R. J. Shiller (1987). “Stock Prices, Earnings, and Expected Dividends.” The Journal of Finance 43(3): 664).
 Source: https://www.gurufocus.com/shiller-PE.php (All-time historical average)
The Shiller P / E ratio also gives you an idea of how many years the company can pay you when you deposit money with a company on the exchange. For example, if this ratio is between 10-15, the company can pay your deposit in 10-15 years. As seen in Figure, the historical average of this rate is around 17, so it would be appropriate to invest in such a situation. This rate went up to 30 in the crisis that broke out in the US New York Stock Exchange on 29 October 1929 and called the “Great Depression” (See Figure 15). Figures show the course of the Shiller P / E ratio since 1890. The year 2000, when this rate was exceeded, was the year when the technology (dot.com) bubble in the USA burst. As seen in Figure, this ratio is around 30 by 2020. This is one of the most important indicators of the global crisis we are in.