In this article, I would like to talk about the indicators that became more evident on the way to perhaps the biggest economic and financial crisis in history.
The world is heading towards a major economic collapse. This collapse will likely be well visible in 2023. The Federal Reserve is still printing money. While the balance sheet of the American central bank continues to increase, unfortunately, a recession continues in the world and the American economy.
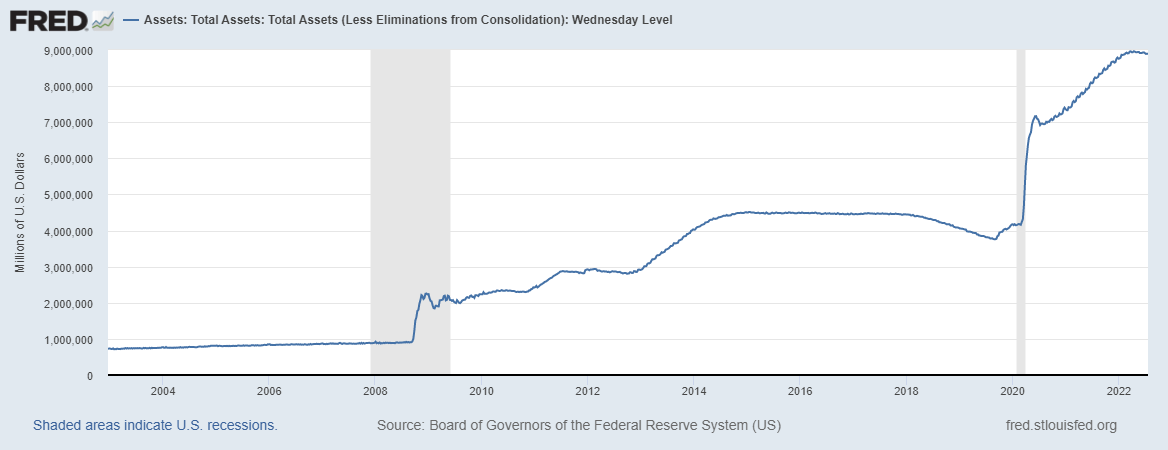
Source: https://fred.stlouisfed.org/series/WALCL#
These serious recession indicators in the world economy have existed since 2021, especially since the autumn of 2021.
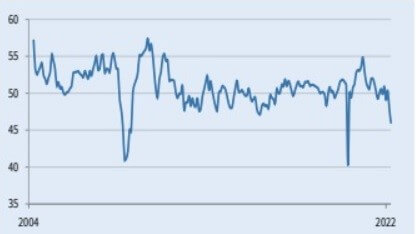
If we look at China first (because China is the world’s production engine), the PMI index in China seems to have peaked around 55 after 2020. As it is known, when the PMI index falls below 50, it can be said that production shrinks and an economic contraction can be expected.
The PMI index in China fell below 50 as of the first quarter of 2022.
As it turns out, China is slowing down. So what is the significance of China’s slowdown for the world?
If China slows down, the world stops.
According to the April 2022 report, the slowdown in the economy became visible after the shutdown in China due to Covid 19 measures. For example, retail sales fell 11.1%, industrial output 2.9%, manufacturing output 4.6%, electricity output 4.3%, crude steel output 5.2%, apparel oil demand 6.7% and YTD home sales 32%.
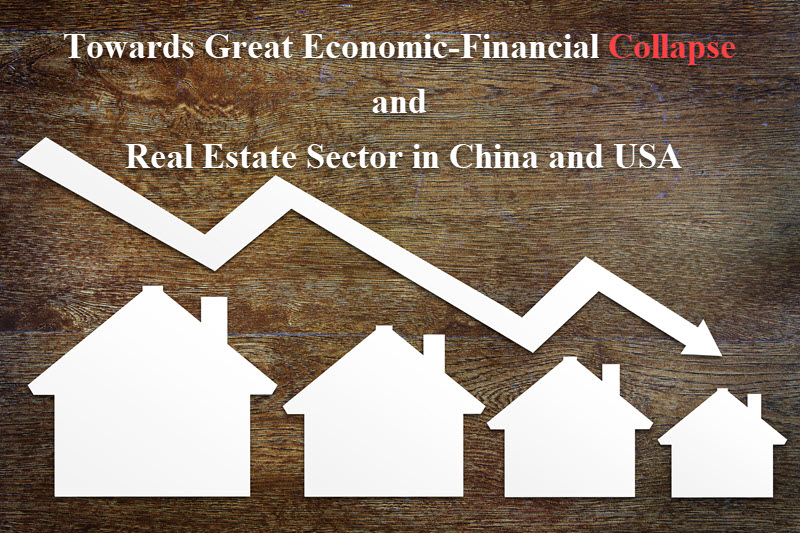
The real estate industry in China is worth approximately $65 billion. Will the 32 percent decline in the real estate sector cause a real estate crisis?
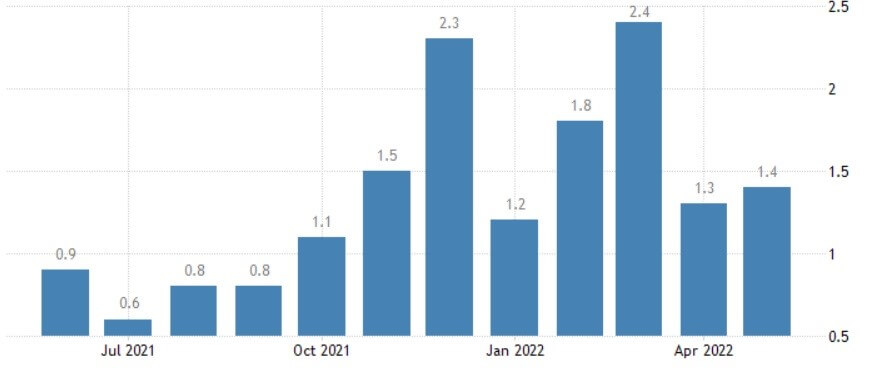
Source: https://tradingeconomics.com/united-states/business-inventories
When we look at America, we see signs of stagnation even though a significant amount of money has started to be burned within the scope of the fight against inflation. When we look at the graph, we see that a significant part of the goods produced since 2020 are waiting in the warehouses of the companies. Major grocery stores in America say that they have purchased about 45 billion dollars worth of goods but cannot sell them.
America gave around $1.9 billion directly into the hands of citizens during Covid. Contrary to 2008, this is the first money given directly to citizens. In 2008, about this amount of money was given to banks to bail out the banks. Probably the reason for the inflation may be this money given to the citizens. Since the citizens are not given money anymore, the citizens cannot spend money either.
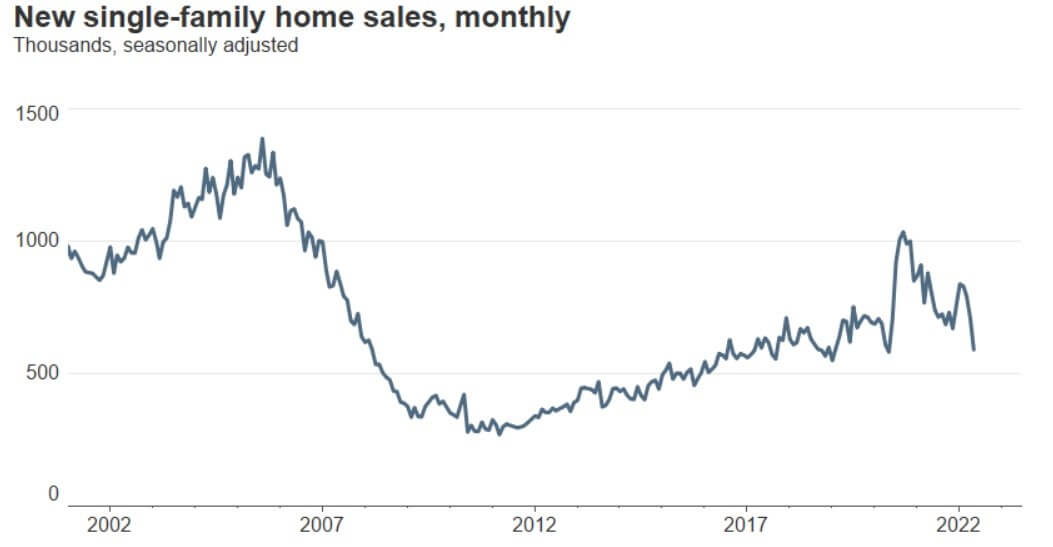
1 million homes were sold in the US in August 2020. Sales have been falling continuously since then, and it is seen that the last time it fell below 600 thousand in April 2022. There is a decrease of almost 40 percent.
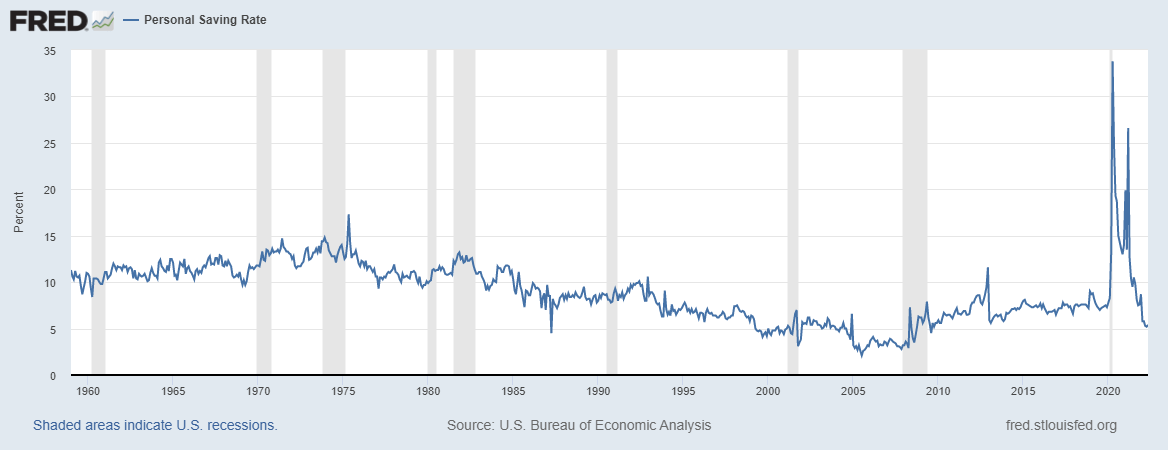
Source: https://fred.stlouisfed.org/series/PSAVERT#
This decline in the housing sector in the Chinese and American economies affects the whole world negatively. This deterioration is happening even though the FED has just increased interest rates by 0.75 points.
As can be seen in the chart, the savings rate increased in the period when citizens entered their pockets directly in 2020, then we see that the savings rates decreased when the money given was exhausted. So much so that the level of savings seems to have fallen to the level of the 2008 crisis. Probably, as the money continues to be burned, the savings rate, which is 4.4, will decrease to the level of 2 and the crisis will deepen when there is no more money to spend.
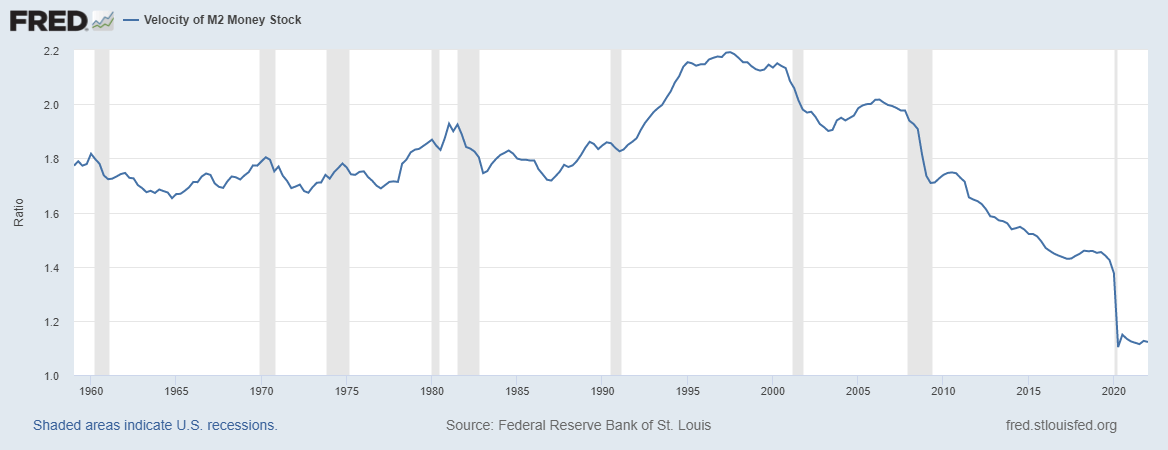
Source: https://fred.stlouisfed.org/series/M2V#
As it is known, the velocity money shows how many times money changes hands in the market after it is produced. As seen in the graph, the velocity of money has not increased since 1997 in the
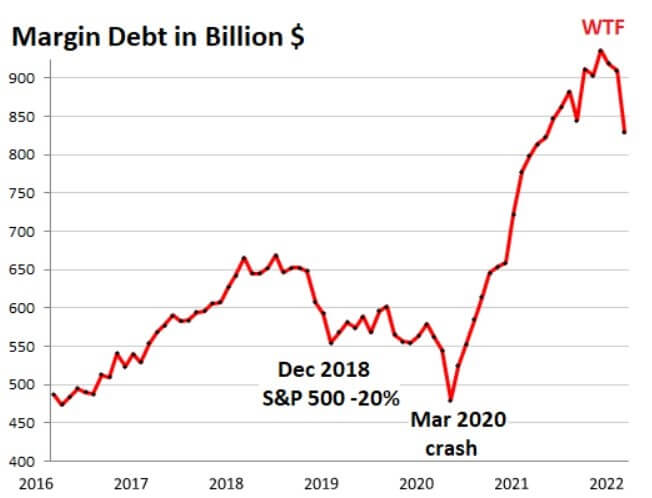
Margin debt, that is, the rate of those who trade in the stock market by borrowing, has been in a rapid decline especially since the last spring of 2020.
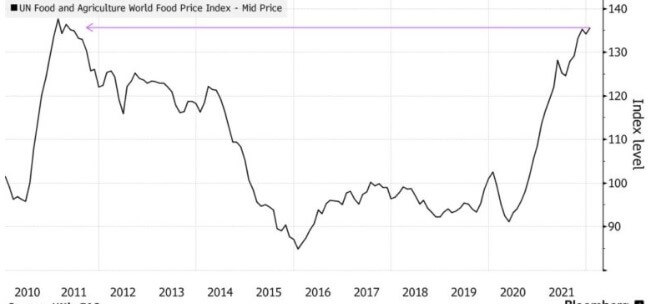
Source: https://farmpolicynews.illinois.edu/2022/02/global-food-prices-climb-towards-record/
Another important crisis indicator is food prices. As you can see, there is a rocket-like increase in prices.
Finally, all this bad picture has occurred even though the FED has not yet fully started to burn money. However, when interest rate hikes come, the size of the crisis will grow.