The ratio of the total household debt to production, which includes the debt of the private sector and households on a country basis as well as the debt of the states in the world, is another important indicator that can give an idea about the magnitude of the destruction to be experienced in the crisis.
In the figure 1, we see the table showing the ratio of household debt to country production. According to the table, the world’s most indebted people are Switzerland, whose debt is 1.34 times the total production of the country. It is followed by Australia with 1.19 times, Denmark with 1.11 times and Canada with 1.06 times.
Figure 1. Household Debt-to-GDP
Source: www.tradingeconomics.com
While explaining the people’s debt in developed countries, we can look at how much money these countries print compared to their annual production. In the figure, we see the ratio of the money printed by the central banks to the annual production (GDP).
In the table, we see that the US central bank prints 28% of the country’s annual production. The normal acceptable level of this is around 5-10%. While the European central bank (ECB) prints 43.68% of Europe’s total annual production, the Bank of Japan (BoJ) 109.91%, the British central bank (BoE) 21.7%. they printed money.
Figure 2. Total Central Bank Assets/GDP
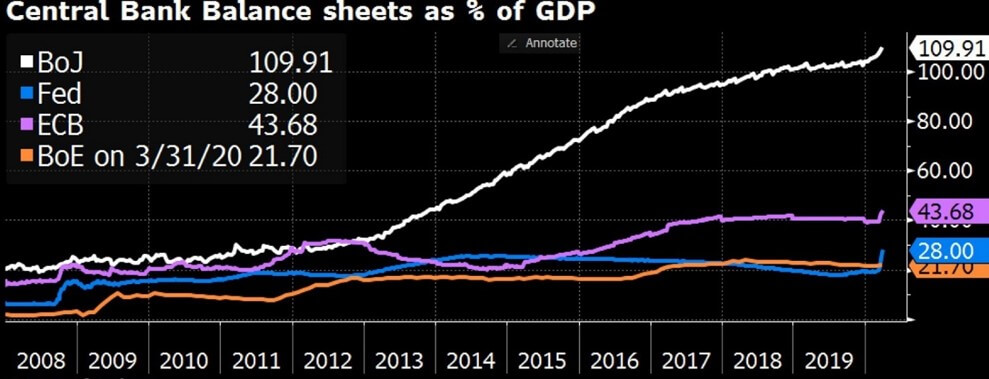
Source: www.bloomberg.com