Another important indicator of the global crisis is the ballooning in the real estate market as a result of excessive pricing. It is necessary to briefly summarize the situations in which there is a problem in the real estate market and many of them will show the risk of collapse in the market if they happen.
We can summarize these data, which shows the current state of the market, in five main points. Their realization marks the beginning of a very critical period for the market. The first is that the bubble of assets bursts. A crisis usually occurs when the asset bubble bursts.
The sign of the bubble that caused the crisis is the rapidly rising house prices. In Figure 1, we see the situation of house prices in the last twenty years. Prices started to rise rapidly before the crisis that started with the bursting of the real estate bubble in 2008.
Prices, which started to fall with the crisis, created a deflationary environment. The national average home price in the US hit a record high of $212,433 in January 2020. That was 15% higher than the record high of $184,613 in July 2006, according to the Case Shiller Housing Price Index. The S&P Homebuilders Select Industry Index increased 250% from 1,372.60 in October 2011 to 4,867 on 12 February 2020 (“S&P/Case-Shiller U.S. National Home Price Index.” from https://fred.stlouisFed.org/.).
Figur 1. Global House Price Index
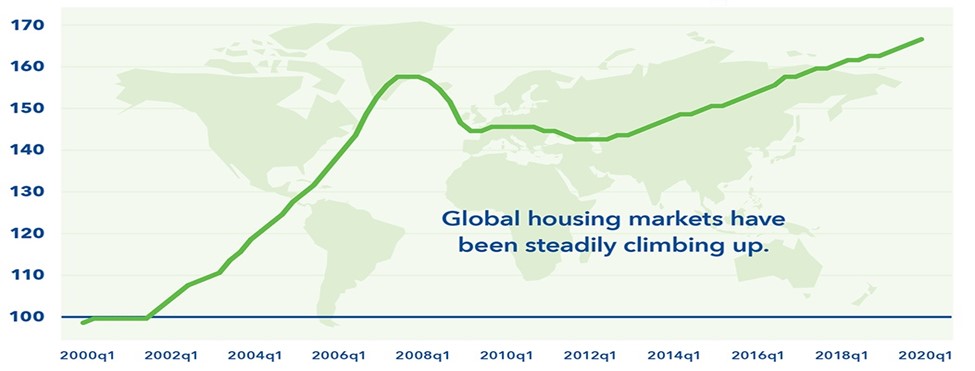
Source: Bank for International Settlements, European Central Bank, Federal Reserve Bank of Dallas, Savills and National Sources (Global housing markets have been steadily climbing up)
Second is the increase in the number of mortgage brokers who are out of regulation and cannot be controlled. The reason this poses a risk is that these institutions are out of control and regulation and cannot survive when the crisis begins. For example, five of the ten largest mortgage lenders in the US are not banks and are not as regulated as banks. The third is increasing interest rates. As is known, high interest rates make loans more expensive and decrease the loan demand. There is no problem with the slow and steady increase in interest rates, sudden increases that cause problems.
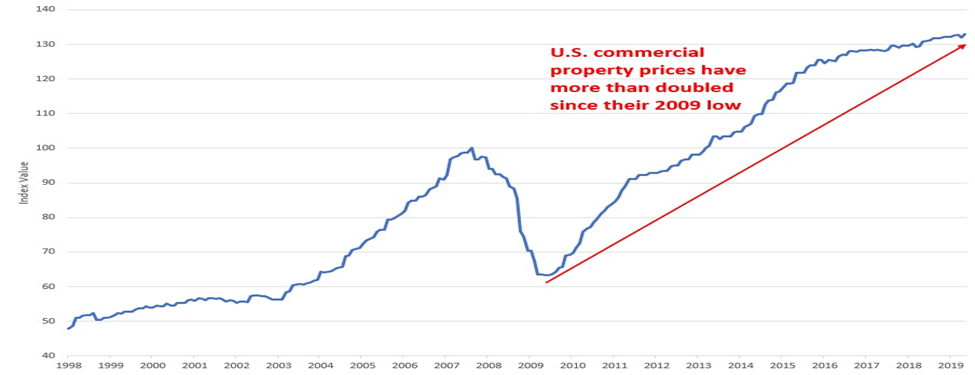
Source: Green Street Advisors (U.S commercial property prices have more than doubled since their 2009 low)
The rapid increase in property prices is actually related to the fall in interest rates in the historical process. Fed interest rates followed a declining course until 2006, after the crisis experienced with the bursting of the technology bubble (dot.com buble) in 2000. The crisis caused investors to seek safer ports and turned their eyes to the real estate market. Demand for real estate has begun to increase when asset returns have fallen. Thus, house prices nearly doubled between 2000 and 2008, when the crisis broke out, as seen in figure 2 (McKibbin, W. (2006). “Bursting of the US Housing Bubble.” Bursting of the US Housing Bubble 14).
Before the crisis that broke out in 2008, the Fed’s interest rates increased very rapidly between 2004 and 2006. Increasing interest rates caused borrowers to have serious difficulties in loan repayments. In Figure 2, we see the course of the house price index in the USA for the last 20 years.
With house prices dropping sharply after the 2008 crisis, mortgage holders could not make payments or sell the house. As a result, default rates soared. As can be seen in Figure 2, in the last decade between 1998 and 2008, when the crisis started, the house prices index increased almost twice from 50 to 100.
When the prices fell right after the crisis, that is, based on the year 2009, the index, which was 62 this year, is above 130 as of 2019 in ten years. This is largely due to the fact that almost all kinds of asset value increases by the QE programs that the Fed has conducted as part of the unlimited money experiment over the past decade. On average, US commercial real estate prices have more than doubled or 111% since their lowest in 2009.
Thirdly, another important indicator to look at when evaluating the real estate market is the “capitalization rate” or shortly the “CAP” rate. This rate, which we will call only the CAP rate from now on, is the capitalization rate, the ratio of the net operating income to the real estate asset value of NIG (net operating income, NOI).
For example, if a property was recently sold for $ 100,000 and the NIG value is $ 10,000, the upper rate will be $ 10,000 / $ 100,000 or 10% CAP rate = NIG / Real Estate Sale Value (cost)). In Figure 3, we can see the course of the US CAP rate between 1980 and 2018. The opposite of the CAP ratio is the price / earnings ratio. The trend of CAP rates in the real estate market over the last few years is an important indicator of where the market is headed.
For example, if CAP rates are falling, it indicates that property prices are rising and the market is starting to warm up. So, if the CAP rate is increasing, it means that the earnings are increasing more than the cost, in this case investors turn to the real estate market. Here, at what levels this ratio may pose a risk is another matter of consideration.
Figure 3. US CAP Rate
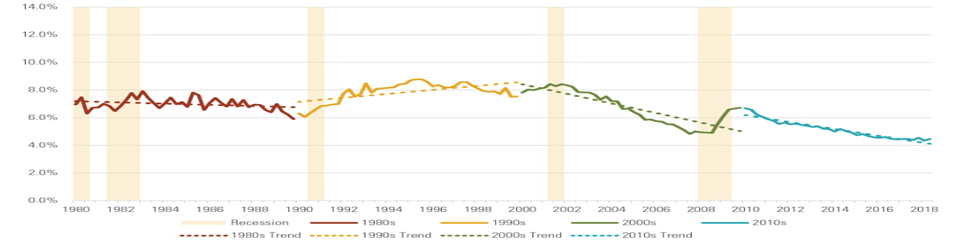
Source: https://www.rclco.com/publication/
If we examine the CAP rate and house price indices during crisis periods in Figures 2 and 3, we see that the rapidly increasing house prices between 2000 and 2008 decreased the CAP rate.
Finally, another indicator that evaluates the real estate market is the inverted yield curve. A warning sign for the real estate market is the reversal of the yield curve in the US Treasury. We can explain the situation of yield reversal as follows: When the short-term treasury bills interest rates are higher than the long-term treasury bills yields, the yield curve is said to be reversed. Normally, short-term bond returns are lower because the risk is also low. In contrast, this shows that investors think that short-term Treasury bills are more risky than long-term Treasury bills. This also harms the real estate market and often indicates a recession.
Figure 4. US Reverse Yield Curve
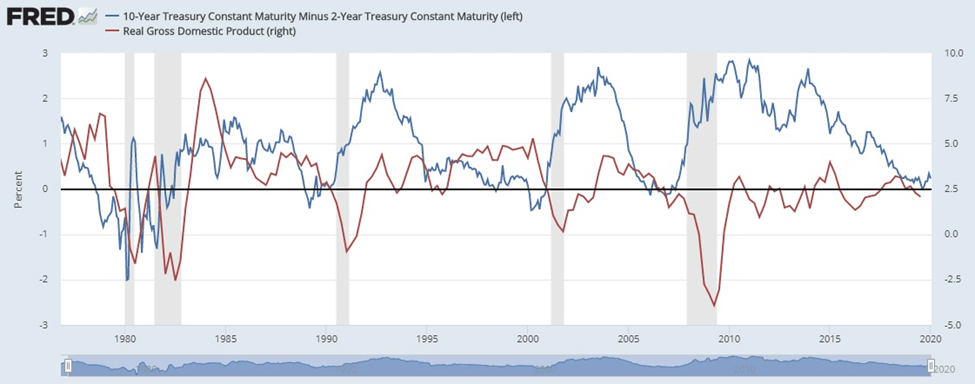
Source: www.fred.stlouisFed.org. (10-year treasury constant maturity minus 2-year treasury constant maturity (left))
The yield curve is one of the best economic indicators that most investors and economists overlook. In Figure 4, we see the fluctuations of the reverse yield curve and real GDP between 1980-2020 in the USA. Light gray areas are periods of crisis. About two years after the yield curve reverses, there is a recession and a collapse in the stock market. It starts to increase just before the crisis. In the graph, the curve has entered a general downward trend since 2012 and the slight increase in 2020 increases the crisis expectation in 2021.