
War, energy, gold, and the patient reckoning beneath the surface of global markets
Arzu ALVAN / April 2026
There is a strange architecture that emerges when the old one is still standing but no longer holds weight. You do not always see it. The columns look fine. The walls have not cracked. But if you press your hand against the structure, you feel something different. A vibration. A looseness. The building is still upright, but it is no longer the same building.
I have been thinking about this sensation for the better part of two years now. Since the Strait of Hormuz crisis sharpened in late 2025, since gold crossed $4,000 and kept climbing, since the yield curve reinverted and then un-inverted again like a patient who keeps returning to the hospital with different symptoms but the same disease. The global financial system is not collapsing. But it is being quietly re-engineered, and the blueprints are not written in any single document. They are scattered across shipping routes, defense budgets, commodity exchanges, and central bank balance sheets.
Mustafa Kemal Ataturk once understood something that most modern economists have forgotten: you cannot read an economy without reading the map of wars around it. Economics does not float above geography. It is geography, dressed in numbers. This is why I believe the most important financial analysis today is not about interest rate forecasts or earnings multiples. It is about understanding which walls are still holding weight and which ones are quietly being replaced.
1. The Map of Fires
Global crises do not invent new plots. They reuse the same one, in new costumes. In April 2026, there are four active conflicts reshaping global capital flows, energy routes, and defense spending. None of them is resolved. All of them are expensive.
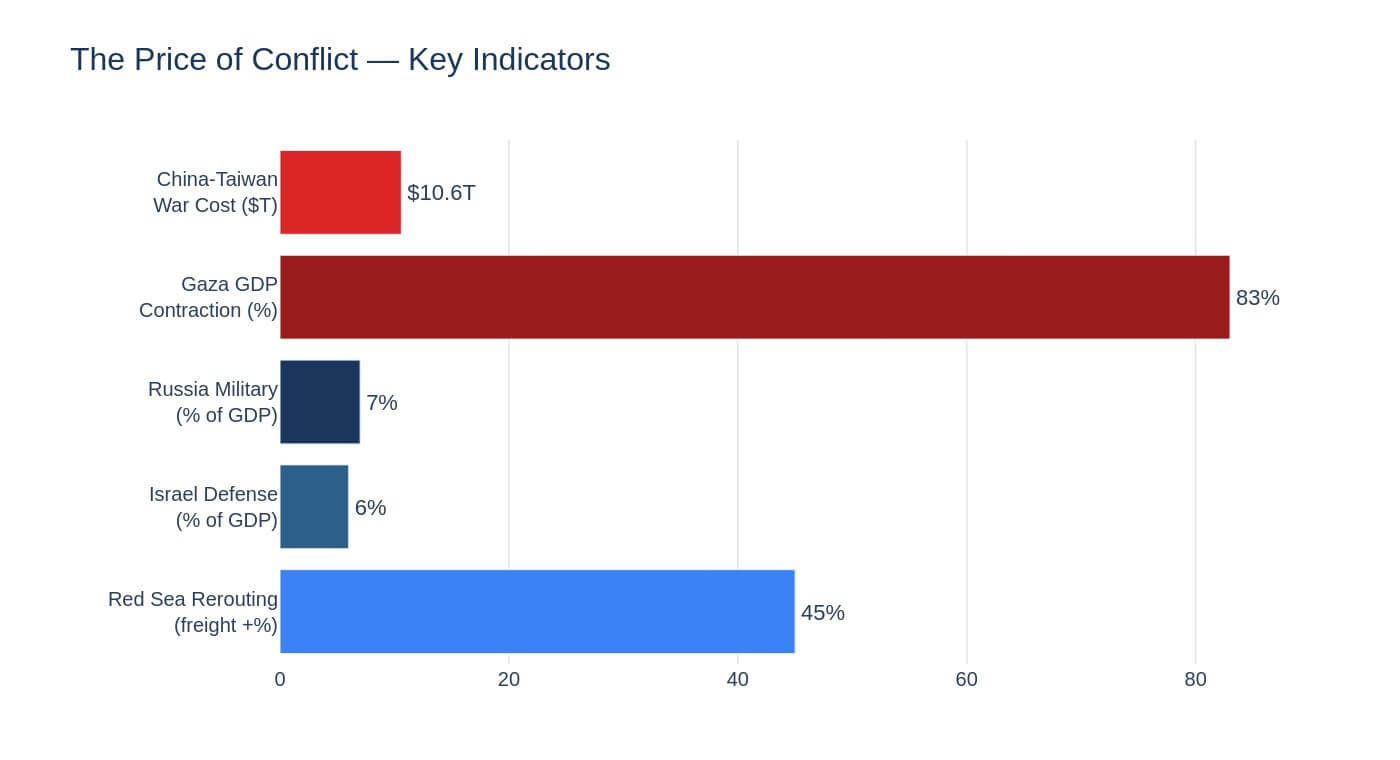
Figure 1. The price of conflict across major geopolitical flashpoints. Sources: IMF, World Bank, Bloomberg, Reuters.
The Russia-Ukraine war, now entering its fifth year, has become a structural feature of the European economy rather than a temporary shock. Russia is spending over 7% of GDP on its military, a figure that quietly erodes private investment, institutional trust, and long-term productive capacity. The IMF forecasts Russian growth at just 1.0% for 2026. Ukraine, meanwhile, survives on approximately $50 billion in annual foreign aid, with its entire domestic revenue directed toward the war effort. Its GDP is still 20% smaller than it was in 2021.
The Israel-Palestine conflict has produced numbers that should trouble anyone paying attention. Gaza’s GDP contracted by 83% in 2024. Unemployment there reached 80%. Infrastructure damage stands at $18.5 billion. Israel’s own defense spending has risen to a projected 6% of GDP for 2026, up from 4.5% before the conflict. The estimated economic cost over the next decade is $400 billion in lost activity. That is not a headline. That is a reckoning.
Then there is Taiwan. No shots have been fired, but the economic cost of a potential conflict is staggering: an estimated $10.6 trillion in the first year alone, roughly 9.6% of global GDP. The reason is simple and terrifying: Taiwan produces over 90% of the world’s most advanced semiconductors. A disruption there would not be like an oil shock. It would be like removing the nervous system from the global economy.
And beneath all of this, the Red Sea crisis continues. Houthi attacks on commercial shipping have turned the rerouting around Africa’s Cape of Good Hope into a new normal, adding 10 to 14 days to Asia-Europe voyages and keeping freight rates 25–45% higher than pre-crisis levels. Think of it in everyday terms: if every delivery truck in your city suddenly had to drive 40% farther for every trip, you would not just get slower deliveries. You would get fewer deliveries. Shelves would thin. Prices would rise. That is exactly what is happening.
2. The Pulse Beneath the Surface
Commodities are the body temperature of the global economy. When they are stable, nobody talks about them. When they spike, everyone suddenly remembers that civilization runs on oil, gas, and metal, not on software alone.
| Commodity | Price (17 Apr 2026) | All-Time High | YoY Change |
| Brent Crude Oil | $91.87 / bbl | $147.50 (Jul 2008) | Elevated; EIA avg forecast $96 |
| Gold | $4,833 / oz | $5,608 (Jan 2026) | +40% YoY |
| EU Natural Gas (TTF) | €38.77 / MWh | €345 (Mar 2022) | +9.6% YoY |
Table 1. Key commodity prices as of April 17, 2026. Sources: Reuters, EIA, ICE.
Brent crude fell to $91.87 per barrel on April 17, a sharp single-day drop following the announced reopening of the Strait of Hormuz and cautious optimism about US-Iran peace talks. Just two days earlier, it was $96.83. The EIA’s average forecast for 2026 remains at $96, assuming gradual normalization. But assumptions, as 1973 and 2008 both taught us, are the first casualties of geopolitical surprise.
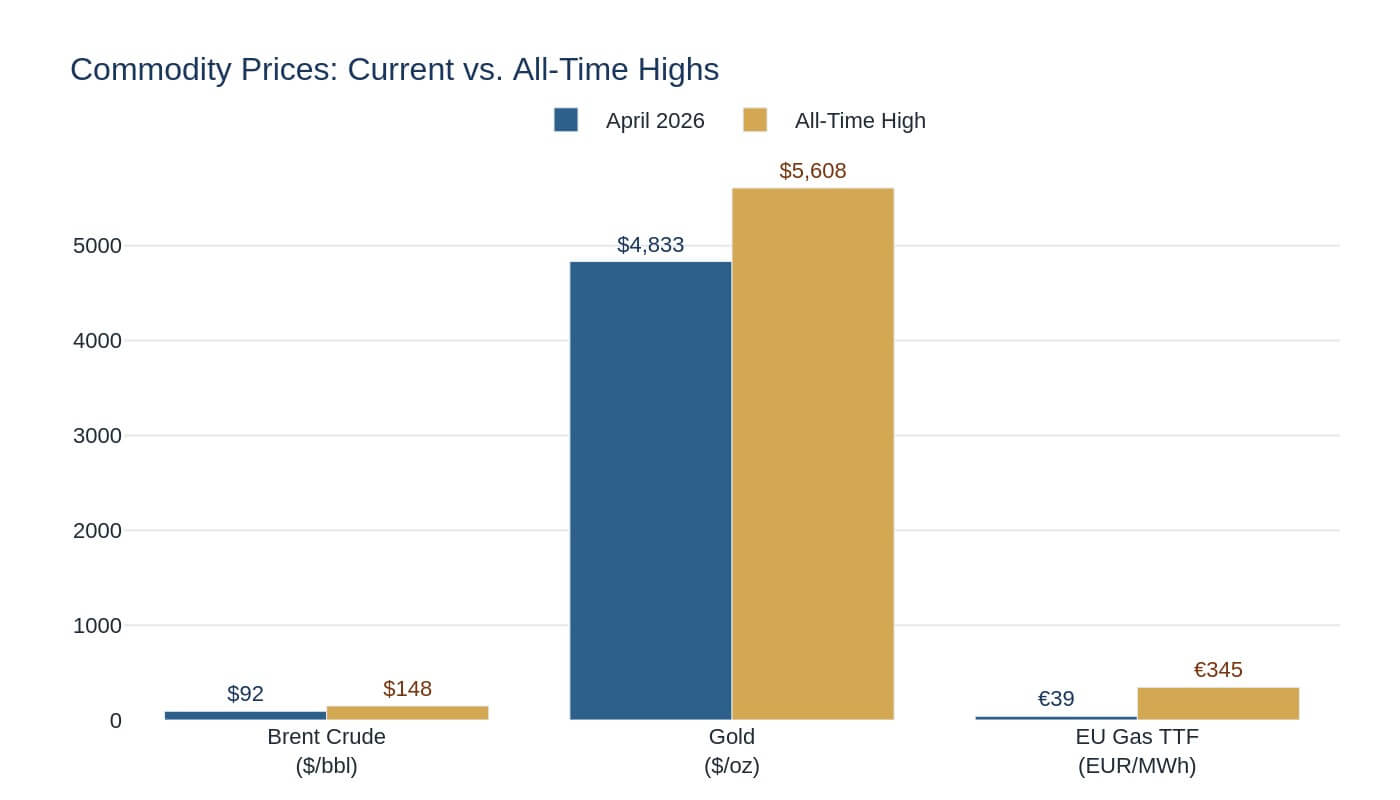
Figure 2. Commodity prices: current levels vs. all-time highs. Sources: Reuters, EIA, ICE, LBMA.
Gold is the more revealing story. At $4,833 per ounce, it sits more than 40% above its level from a year ago. It pulled back from the January 2026 high of $5,608, but the trajectory tells you something important: central banks are buying, inflation expectations remain sticky, and the dollar is weakening. Gold does not rise because people are optimistic. Gold rises because people are quietly hedging against something they cannot name.
European natural gas at €38.77 per MWh may seem calm compared to the €345 peak of March 2022, but it remains nearly 10% higher than a year ago. The Strait of Hormuz reopening brought an 8.6% daily decline, proof that energy markets remain acutely sensitive to geopolitical chokepoints. The infrastructure has not changed. The vulnerability has not changed. Only the headline has changed.
3. The Architects with the Slowest Hands
Central banks move slowly on purpose. They are the architects who believe that if you change the foundation too quickly, the building above will crack. But sometimes, the building is already cracking, and the architects are still reading their blueprints.
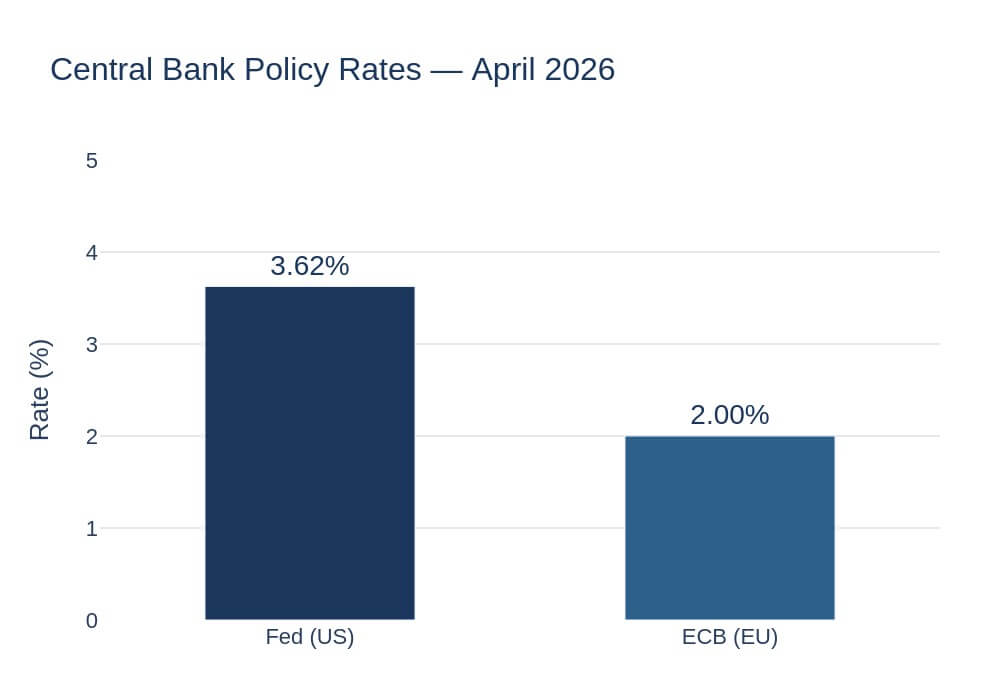
Figure 3. Central bank policy rates, April 2026. Sources: Federal Reserve, ECB.
| Central Bank | Current Rate | Last Action | Outlook |
| US Federal Reserve | 3.50–3.75% | 25bp cut (Dec 2025) | Data-dependent; path toward 3.00–3.25% |
| ECB (Deposit) | 2.00% | 25bp cut (Jun 2025) | Meeting-by-meeting; cautious |
| ECB (Main Refi) | 2.15% | 25bp cut (Jun 2025) | Watching energy & inflation |
Table 2. Central bank policy rates and recent actions. Sources: Federal Reserve, ECB.
The Federal Reserve sits at 3.50–3.75%, held steady since December 2025. Projections from Fed officials suggest a potential path toward 3.00–3.25% over the remainder of 2026, but every statement is wrapped in the same careful language: data-dependent. The ECB has not moved since June 2025, holding its deposit rate at 2.00% while adopting a meeting-by-meeting approach. Both institutions are watching energy prices and geopolitical risk with one eye, and domestic inflation with the other.
This is where the story gets more nuanced. In past crises, central banks could cut aggressively because inflation was subdued. In 1973, they were caught off guard. In 2008, they had room to act. In 2020, they printed trillions because deflation was the greater fear. Today, neither the Fed nor the ECB has the luxury of a clear path. Inflation is not dead. Growth is not collapsing. They are stuck in the middle, which is perhaps the most dangerous place to be.
4. The Currency That Holds the Map Together
A currency becomes global not only because it is strong, but because it can travel. It needs roads, ports, pipes, banks, contracts, trust, and also fear. The US dollar has all of these things. But some of them are showing signs of wear.
| DXY Metric | Value |
| Current Level (17 Apr 2026) | 98.23 |
| 1-Month Change | −1.85% |
| 12-Month Change | −1.15% |
| All-Time Low | 70.70 (Mar 2008) |
| 2026 Year-End Forecast Range | 92–98 |
Table 3. DXY US Dollar Index overview. Sources: Bloomberg, Reuters, institutional forecasts.
The DXY Dollar Index at 98.23 has weakened by 1.85% over the past month and 1.15% over the last twelve months. Most institutional forecasts place the year-end DXY between 92 and 98, reflecting an expectation that safe-haven demand will unwind as geopolitical tensions ease. But the direction matters more than the number. A weakening dollar, combined with rising gold and persistent commodity inflation, tells a story that is older than any of us: the slow, patient redistribution of trust.
I am not suggesting the dollar is about to lose its reserve status. That kind of change does not happen in quarters. It happens in decades. But the architecture is shifting. China’s CIPS settlement system, the expansion of bilateral currency agreements, the steady central bank accumulation of gold — these are not headlines. They are plumbing. And plumbing, once installed, does not easily get removed.
5. What the Dashboard Says and What It Does Not
When I look at the data together, as a dashboard rather than individual readings, I see something that I can only describe as a patient contradiction.
| Indicator | Current Value | Signal | Historical Context |
| S&P 500 | 7,126 | All-time high; Q1 earnings +13.2% | Bull market intact |
| US Manufacturing PMI | 52.7 (ISM) | Expansion (>50) | Headwinds from tariffs & supply chains |
| US Unemployment | 4.3% | Stable; 7.2M unemployed | Unchanged YoY |
| US 10Y Yield | 4.26% | Declining on easing tensions | Was inverted Jul 2022–Aug 2024 |
| Yield Curve (10Y–2Y) | +0.55% | Normal (positive slope) | Recession signal ended |
Table 4. US growth and crisis signal dashboard, April 2026. Sources: S&P Global, ISM, BLS, US Treasury.
The S&P 500 at 7,126 is at an all-time high. Eighty-eight percent of reporting companies beat earnings expectations in Q1, with blended earnings growth at 13.2%. Manufacturing PMI is above 50. Unemployment is steady at 4.3%. The yield curve, which was inverted from July 2022 through August 2024 — the longest inversion in modern history — has finally normalized with a spread of +0.55%.
On the surface, this looks healthy. Strong equity markets. Expanding manufacturing. Stable employment. Normal yield curve. If you read only these numbers, you would conclude that the economy is in solid shape.
But here is what the dashboard does not tell you.
It does not tell you that the S&P 500’s year-end consensus target among top strategists sits between 5,400 and 5,600 — roughly 21 to 24% below its current level. That gap between market price and analyst targets is one of the widest in recent memory. It does not tell you that manufacturing expansion is being sustained partly by front-loading orders ahead of tariff deadlines, not organic demand growth. It does not tell you that the yield curve’s normalization often happens not before a recession begins, but as it begins. In 2007, the curve uninverted in the summer. By December, the recession had started.
I am not predicting a recession. Predictions are fragile, and I hold this one with humility. But I am saying that the surface and the depth are telling different stories, and I have learned to pay more attention to the depth.
6. The Reckoning That Does Not Announce Itself
Let me now try to bring these threads together, because they are not separate stories. They are layers of the same structure.
| Domain | Surface Reading | Deeper Signal |
| Geopolitics | Tensions easing (Hormuz reopened) | Four active conflicts; defense budgets rising |
| Energy | Oil pulled back from $97 to $92 | Chokepoint vulnerability unchanged; LNG rerouting permanent |
| Gold | Retreated from $5,608 high | Central banks still accumulating; trust shifting |
| Dollar | DXY at 98, still dominant | Weakening trend; alternative plumbing expanding |
| Equities | S&P at all-time high | Analyst targets 21–24% below; earnings quality uncertain |
| Rates | Fed on hold; path to cuts | No room for aggressive cuts; inflation sticky |
Table 5. Surface readings vs. deeper structural signals across key domains.
The world order that was built after 1945 — and reinforced after 1991 — rested on a few pillars: American military dominance, the dollar as the settlement currency of global trade, free passage through maritime chokepoints, and a set of institutions (the IMF, the World Bank, the WTO) that everyone complained about but nobody seriously challenged. Today, every single one of those pillars is under pressure. Not breaking. Not collapsing. But being quietly tested, the way you test a bridge by driving heavier and heavier trucks across it.
Russia’s war demonstrated that energy can be weaponized. The Red Sea crisis showed that maritime freedom is not guaranteed. China’s CIPS and gold accumulation suggest that at least one major power is building alternative plumbing. And the dollar, while still dominant, is weakening at the margins — not because anyone has replaced it, but because the conditions that made it indispensable are slowly, patiently, being renegotiated.
Ataturk would have recognized this pattern. He understood that the real shifts in power do not happen on the battlefield alone. They happen in the architecture beneath the battlefield — in supply lines, in financial agreements, in the quiet choices countries make about where to store their wealth and whom to trust with their trade. He also understood that by the time most people recognize a new order, it is already built. The construction happens in silence.
This is why I believe the most important question in global finance right now is not whether the Fed will cut rates, or whether the S&P will hold at 7,000. Those are surface questions. The deeper question is: who is building, and what are they building toward?
The answer, in my reading, is that we are in the early construction phase of a more divided global system. Not a clean split — economies are too entangled for that — but a gradual layering. A world where the dollar still dominates but shares more of the room. Where energy still flows but through more contested routes. Where gold is not just a hedge but a statement. Where defense spending is not a choice but a structural feature of national budgets, crowding out the kind of investment that produces long-term growth.
A Final Observation
I began this piece with the image of a building that is still standing but no longer holds weight in the same way. I want to return to that image, because I think it captures something important about where we are.
The financial system is not breaking apart. The markets are at record highs. Employment is stable. Commodity prices, while elevated, are not in crisis territory. Central banks are cautious but not panicking. If you look only at the surface, you would say: things are fine.
But the architecture underneath is different from the architecture of five years ago, or ten years ago, or certainly twenty. The walls have been patched so many times that it is difficult to tell what is original structure and what is repair work. And there are new rooms being added — rooms that not everyone has access to, rooms where different conversations are happening, in different currencies, with different rules.
The old building is still standing. But if you press your hand against the wall, you will feel it. Something is being built next door. Quietly. Patiently. And the new building does not need the old one’s permission to rise.
For now.
Key Concepts
DXY (Dollar Index): A weighted index measuring the US dollar against a basket of six major currencies. A declining DXY signals weakening dollar purchasing power globally.
Yield Curve Inversion: When short-term government bond yields exceed long-term yields, historically a precursor to recession. The US curve was inverted from July 2022 to August 2024.
PMI (Purchasing Managers’ Index): A monthly survey of manufacturing activity. Above 50 indicates expansion; below 50 signals contraction.
TTF (Title Transfer Facility): The benchmark European natural gas pricing hub, quoted in EUR per megawatt-hour.
CIPS: China’s Cross-Border Interbank Payment System, an alternative to SWIFT for settling international transactions in yuan.
Brent Crude: The international benchmark for crude oil pricing, extracted from the North Sea.
Disclaimer: This article is written for informational and educational purposes only. It does not constitute investment advice, financial guidance, or a recommendation to buy or sell any security or asset. All data is sourced from publicly available reports and is believed to be accurate as of the publication date. The author assumes no liability for decisions made based on this content.
Sources
[1] US Energy Information Administration (EIA), Short-Term Energy Outlook, April 2026.
[2] Reuters, “Brent crude drops as Hormuz reopens,” April 17, 2026.
[3] London Bullion Market Association (LBMA), Gold Price Data, April 2026.
[4] Federal Reserve Board, FOMC Statement, March 2026.
[5] European Central Bank, Monetary Policy Decisions, April 2026.
[6] International Monetary Fund (IMF), World Economic Outlook, April 2026.
[7] S&P Global, US Manufacturing PMI Report, March 2026.
[8] Bureau of Labor Statistics, Employment Situation Summary, March 2026.
[9] Bloomberg, DXY Index Data, April 2026.
[10] Institute for Supply Management (ISM), Manufacturing Report on Business, March 2026.
[11] World Bank, Gaza Economic Assessment, 2026.
[12] Goldman Sachs, Global Markets Research, Q2 2026.