In order to better understand Shiller’s price / earnings (P/E) ratio, it is necessary to examine the business hours chart that should be worked in the USA in order to purchase the S&P 500. In Figure 1, we see that in the last 20 years, the lowest number of working hours was experienced during the 2009 financial crisis, with an average of 30.9 hours. It is clearly seen on the chart that the stock market bubble in 2000 has also been overcome.
Fıgure 1. Working Hours to Buy the S&P 500
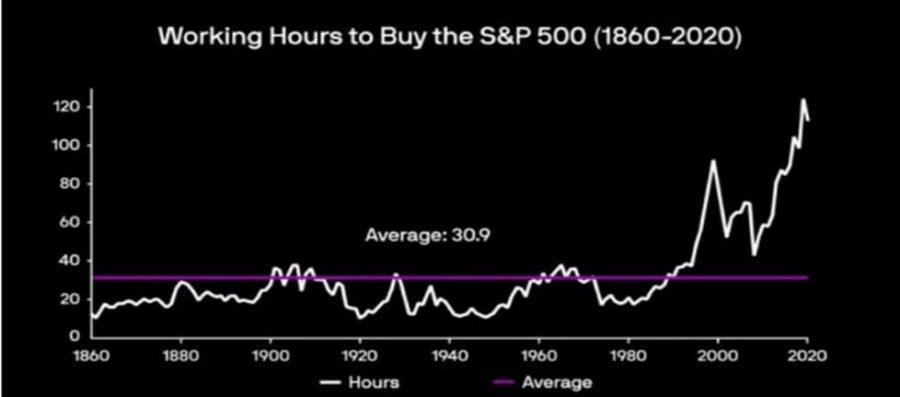
Source: www.goldchartsrus.com, Nick Laird (Working hours to buy the S&P 500)
This is another indication that we are in the biggest stock market bubble ever seen. Another important indicator showing that the stock market is ballooning and the crisis is approaching is the “Buffett Indicator” developed by Warren Buffett, one of the famous US investors.
Figure 2. Buffett Indicator
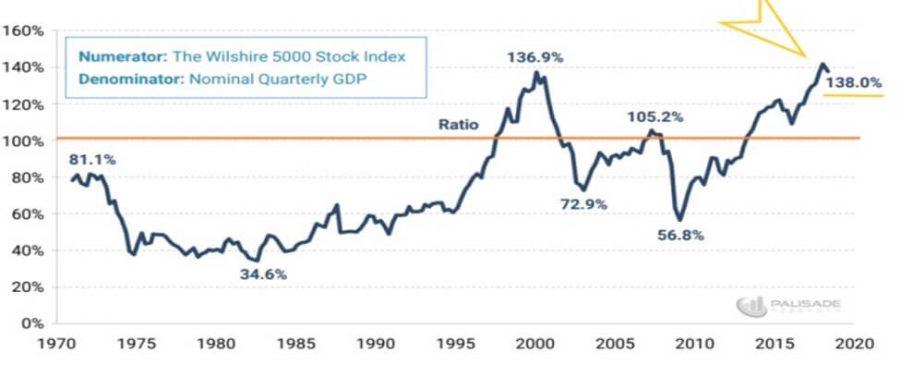
Source: https://palisade-research.com/warren-buffet-indicator-signaling-market-crash/ (Numerator: The Whilshire 5000 Stock Index: Denominator: Nominal Quarterly GDP)