
$14 trillion.
That is how much sovereign debt the world’s governments must refinance in 2026 alone. Not new borrowing. Rollover. Pay off old bonds — issue new ones in their place.
The figure comes from the OECD Global Debt Report 2026. It is not a projection. It is the auction calendar.
The total sovereign bond issuance this year reaches $18 trillion — $14 trillion rolling over existing debt, $4 trillion of genuinely new borrowing. Add corporate bonds and the combined number is $29 trillion. All of it competing for the same global pool of buyers. All of it at rates that did not exist when the original debt was issued.
That is the problem. Not the size. The price.
The Math Nobody Did Out Loud
A government that issued a 10-year bond in 2016 at 1.5% saw it mature in 2026. To honor the old bond, it must sell a new one. The rate on that new bond is approximately 5.17% — the US 10-year Treasury yield as of September 25, 2026.
That is not 1% more. It is 3.5 times more.
On a $1 billion bond, annual interest payments go from $15 million to $51.7 million.
Across $14 trillion in refinancing, every 1 percentage point increase in the average rate adds roughly $140 billion per year in government interest payments globally. The shift from 1.5% to 5% represents approximately 3.5 percentage points — that is approximately $490 billion in extra annual interest on debt that already existed, simply repriced.
The United States is already living with this math. It pays $1.1 trillion per year in interest on its $40 trillion national debt. More than the entire defense budget. The Federal Reserve hiked rates 25 basis points in September 2026, bringing the policy rate to 3.75%–4.00%. No cuts are on the table. Inflation remains above the 2% target.
Think of it this way. Imagine you took out a mortgage at 1.5% in 2016. It expired this year. Your bank offers you a new one — but the rate is now 5.17%. Your monthly payment more than triples. Your income has not. That is the position of every government in this table:
Table 1: Government Debt as Share of GDP (2026 Estimates)
| Country | Debt-to-GDP |
| Japan | ~250% |
| Italy | ~140% |
| United States | ~120% |
| France | ~112% |
| United Kingdom | ~102% |
| OECD Average | ~85% |
| Germany | ~66% |
Sources: OECD Global Debt Report 2026; IMF Fiscal Monitor 2026. Data as of Q2 2026. Germany shown for reference as the sole G7 economy below the OECD average.
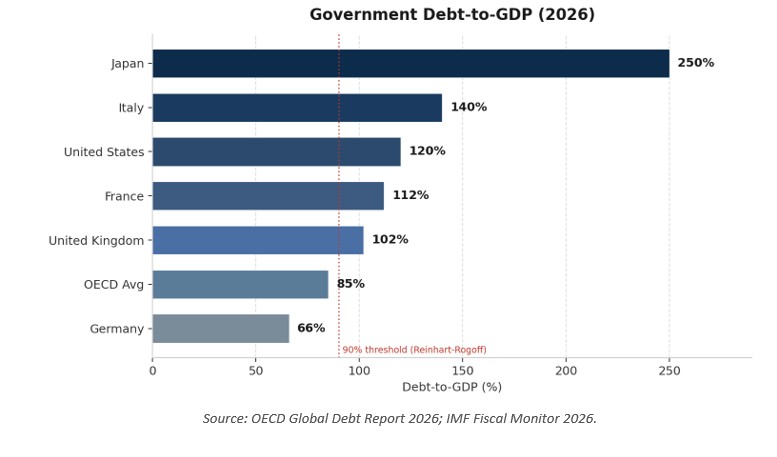
Source: OECD Global Debt Report 2026; IMF Fiscal Monitor 2026.
The Buyers Who Left
There is a buyer question underneath the price question.
Between 2010 and 2022, foreign central banks held enormous quantities of sovereign debt as part of their reserve management. They were structural buyers — not choosing between yield and alternatives, just accumulating Treasuries because that is what reserve managers do. Price-insensitive. Reliable.
That era ended quietly.
China holds $618 billion in US Treasuries as of July 2026 — the lowest level since 2008. At its peak, China held over $1.3 trillion. The decline is not panic. It is policy, running for a decade, slow and deliberate.
Japan, the world’s single largest Treasury holder at $1.203 trillion, sold approximately $87.8 billion in August 2026 alone. Japan is not selling from choice. It is selling because it needs yen to stabilize its own markets after the Bank of Japan raised rates above 3% — a structural pivot examined in detail in “The Japan 3% Moment” (September 6, 2026).
What are those central banks buying instead? 289 tonnes of gold in Q2 2026, up 62% year-over-year, according to the World Gold Council. The logic behind that shift was documented in “The 45% Threshold” (August 2, 2026). The conclusion is simple: central banks are not abandoning sovereign debt overnight. But at the margin, the dollar that used to go into Treasuries is now buying gold. And the margin is what sets the price of debt.
The structural, price-insensitive buyer — the one who absorbed sovereign debt quietly for fifteen years — has stepped back.
The New Buyer Is Not the Same
The gap has been filled. Auctions are clearing. But look carefully at who is doing the buying.
The IMF’s Global Financial Stability Report (April 2026) documents the shift: foreign private investors — primarily hedge funds and asset managers — hold $7 trillion in US Treasuries. Foreign official institutions — central banks — hold $3.9 trillion. The private sector now holds nearly twice as much as the official sector.
Table 2: Who Holds US Treasuries — Foreign Sector (2026)
| Holder Type | Holdings | Share of Foreign-Held Debt |
| Foreign Private Investors (hedge funds, asset managers) | $7.0 trillion | 64% |
| Foreign Official Institutions (central banks, sovereign funds) | $3.9 trillion | 36% |
Source: IMF Global Financial Stability Report, April 2026.
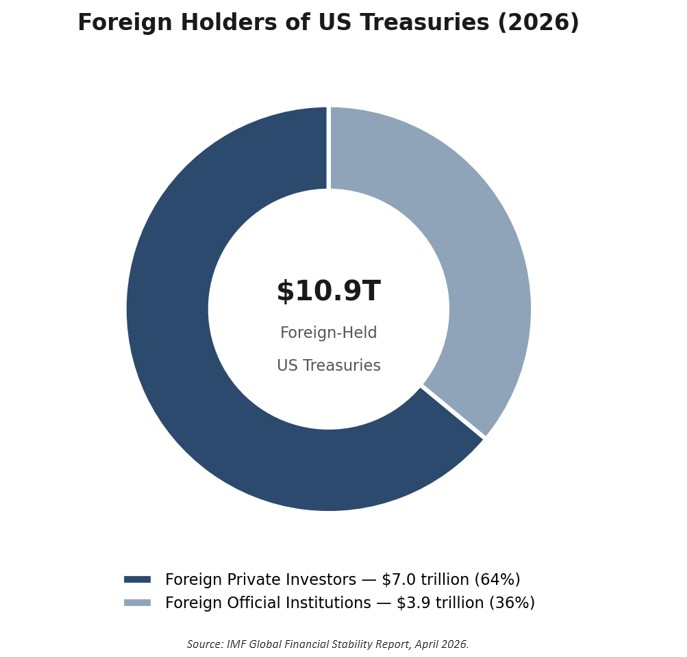
Source: IMF Global Financial Stability Report, April 2026.
A central bank that holds Treasuries as reserve assets does not care if yields rise 50 basis points in a week. It is not running a fund. It has no redemptions. It does not need to explain its positioning to investors.
A hedge fund does.
If a Treasury auction runs unexpectedly thin — if demand is lower than expected and yields spike — a hedge fund long Treasuries will reduce its position. That selling creates more yield pressure, which creates more selling. The buyer that was supposed to absorb stress becomes the amplifier of stress.
The BIS Annual Economic Report 2026 names this dynamic explicitly: “Fiscal stress can now transmit directly into financial market volatility. The fiscal-financial stability nexus has tightened.”
The US version of this buyer shift was documented in “The Last Buyer Standing”. The $18 trillion rollover is where it plays out across every G7 government simultaneously.
What History Keeps Trying to Tell Us
Governments have faced large debts before. They have managed them. But the historical record is less reassuring than official statements suggest.
Carmen Reinhart and Kenneth Rogoff studied sovereign debt crises across 66 countries and eight centuries in This Time Is Different (Princeton University Press, 2009). Their finding: when government debt crosses roughly 90% of GDP, interest costs begin to crowd out productive investment. The margin for error shrinks. Debt becomes self-reinforcing.
Every major economy except Germany in Table 1 is above that threshold today. Not approaching it — above it.
Reinhart and Rogoff also found something else. In the years before a debt crisis, governments consistently shortened the maturity of their borrowing — issuing 3-month and 6-month bills instead of 10-year bonds, trying to wait out high rates. Every economist at the time called it prudent. Every historian called it a warning.
The OECD documents exactly this pattern in 2026: the shift toward shorter maturities has accelerated. More debt coming due sooner. The refinancing cliff is not being avoided. It is being made steeper.
The Three Ways Out
No G7 government will default in the traditional sense. That has not happened in the modern era, and the tools to prevent it — central bank bond-buying programs, emergency facilities, the IMF — exist and are credible.
But credibility has a cost.
When the UK gilt market convulsed in October 2022 — an unfunded budget announcement caused yields to spike 150 basis points in four days — the Bank of England intervened within 72 hours to prevent pension fund insolvencies. No default. No failed auction. But real systemic consequences, resolved only by a central bank absorbing the stress onto its own balance sheet.
That was one country, one budget announcement. The 2026 rollover is 38 OECD governments, $14 trillion, one year.
If multiple sovereign auctions run thin simultaneously — which is plausible when every government is in the market at the same time — governments face three exits. Only three.
Exit 1 — Austerity. Raise taxes, cut spending. Restore fiscal credibility. Cost: recession, slow growth, political instability.
Exit 2 — Financial repression. Hold interest rates below inflation. Savers receive negative real returns. Governments quietly inflate their way out of debt. Cost: a tax on savings that nobody voted on, running for years.
Exit 3 — Monetization. The central bank buys government bonds. Debt is absorbed into the monetary base. Cost: inflation, and the long-term erosion of central bank credibility.
One of these absorbs the $490 billion in extra annual interest the world’s governments did not budget for. One country at a time. One fiscal year at a time. Which path the United States appears to be choosing was examined in “The $40 Trillion Debt Mountain” (September 27, 2026).
The global version is still being decided.
The Verdict
The $14 trillion will be refinanced. The auctions will clear. Governments will not default.
But here is what else is true.
The buyers who used to absorb this debt quietly — because they had to, because that is how you ran reserves in a dollar world — are buying gold instead. The buyers who replaced them are hedge funds with redemption windows and risk limits. The rates at which this debt is being rolled over are triple what anyone budgeted when the original bonds were issued. And every government is in the market at the same time, competing for the same pool of price-sensitive capital.
The bill that every government deferred in the low-rate era has arrived. All at once. At 5%.
The question is not whether it gets paid. It will. The question is what governments give up to pay it.
And more importantly — who is holding the check?
Glossary
Rollover risk: When a government cannot refinance maturing debt on acceptable terms — because buyers are absent or yields have risen too much. Like a mortgage that expires and no bank offers you the same rate anymore.
Maturity cliff: A point in time when a large pile of debt all comes due at once, forcing the borrower to refinance everything simultaneously. Issuing short-term debt to avoid long-term rates makes the cliff steeper, not flatter.
Financial repression: Deliberately keeping interest rates below inflation. The real value of government debt shrinks over time — but so does the real value of your savings. It is a tax you pay without a vote.
Fiscal dominance: When a government’s debt is so large that the central bank can no longer raise rates freely without triggering a fiscal crisis. The government’s financing needs take priority over monetary policy.
Bid-to-cover ratio: At a government bond auction, the total bids received divided by the total bonds on offer. Below 2.0 signals weak demand — and yields rise immediately to attract more buyers.
NBFI (Non-Bank Financial Institution): Hedge funds, pension funds, insurance companies, and similar institutions that hold financial assets but are not regulated as banks. They now hold the majority of US Treasuries owned by foreign private investors.
Sources
- OECD (2026). OECD Global Debt Report 2026. Organisation for Economic Co-operation and Development. https://oecd.org/en/publications/global-debt-report-2026_e9d80efd-en.html
- BIS (2026). BIS Annual Economic Report 2026, Chapter 2: Fiscal-Financial Stability Nexus. Bank for International Settlements. https://bis.org/publ/arpdf/ar2026e2.pdf
- IMF (2026). Global Financial Stability Report, April 2026. International Monetary Fund. https://imf.org/en/publications/gfsr/issues/2026/04/14/global-financial-stability-report-april-2026
- IMF (2026). Currency Composition of Official Foreign Exchange Reserves (COFER), Q2 2026. International Monetary Fund. https://imf.org/external/np/sta/cofer/eng/index.aspx
- US Treasury (2026). Treasury International Capital (TIC) System. United States Department of the Treasury. https://ticdata.treasury.gov/resource-center/data-chart-center/tic/Pages/ticsec2.aspx
- US Treasury (2026). Daily Treasury Yield Curve Rates. United States Department of the Treasury. https://home.treasury.gov/resource-center/data-chart-center/interest-rates
- World Gold Council (2026). Gold Demand Trends Q2 2026. World Gold Council. https://gold.org/goldhub/research/gold-demand-trends
- Reinhart, C. M. & Rogoff, K. S. (2009). This Time Is Different: Eight Centuries of Financial Folly. Princeton University Press. NBER Working Paper No. 13882.
Previously on this topic
“The Last Buyer Standing” · “The Japan 3% Moment” · “The $40 Trillion Debt Mountain” · “The 45% Threshold”