Market observation period: 6 August – 6 September 2026. Every figure in this article carries a dated source, listed at the end. Facts, interpretations and scenarios are clearly separated.
On September 1, 2026, a number appeared on bond screens in Tokyo that had not been seen in thirty years. Japan’s 10-year government bond yield crossed 3 percent (Reuters, September 1, 2026). The last time this benchmark stood at that level was September 1996.
Thirty years is a full generation. A child born on the day Japan’s yield last touched 3 percent has grown up, finished school and started a career in a country where the government always borrowed money almost for free. On September 1, that era ended with a number.
Why should a reader in Istanbul, London or a village in Anatolia care about a bond yield in Tokyo? Because Japan was never just another country. Japan was the world’s largest creditor nation. It was the anchor of the world’s cheapest money. And for three decades, its near-zero interest rates quietly financed the whole world — including the world’s largest debtor, the United States.
The Quiet Engine: What Cheap Japanese Money Did to the World
For thirty years, Japan’s government paid almost nothing to borrow. Its 10-year yield spent most of that time below 1 percent and even went negative in 2016 (ECB data; Bank of Japan). This was not an accident. It was official policy: the Bank of Japan (BOJ) capped long-term rates through a framework called yield curve control from 2016 onward.
Cheap money in Japan did not stay in Japan. Investors borrowed yen at almost zero cost and bought higher-yielding assets abroad — the famous yen carry trade. Japanese life insurers, banks and pension funds, unable to earn anything at home, became massive buyers of foreign bonds, especially US government debt. For years, Japan stood among the largest foreign holders of US Treasuries (US Treasury data via press reports).
The system worked like a quiet engine. Japan supplied cheap capital. America consumed it. Everyone in between earned a spread. In December 2025, I wrote about the fall of the last fortress of ultra-cheap money — the moment the BOJ finally left its negative-rate world (The Last Fortress Falls, December 2025). That article described the exit. This article is about the market’s answer.
The Road to 3%: From Zero to the First Hike in a Generation
The Bank of Japan raised its policy rate from minus 0.1 percent in March 2024 to 1.0 percent in June 2026 — its highest level since September 1995 (BOJ statements). The table below shows the full path.
| Date | Step | Rate / level |
| September 2016 | Yield curve control introduced; 10-year target near 0%; short rate −0.1% | −0.1% (10Y target ≈ 0%) |
| December 2022 | Yield curve control band widened to ±0.5 points | −0.1% (band ±0.5) |
| October 2023 | 1% upper bound made a “reference”, not a rigid cap | −0.1% (1% reference) |
| March 2024 | End of negative rates and of yield curve control | 0–0.1% |
| July 2024 | First hike after the exit | 0.25% |
| December 2025 | Continued normalization (per Reuters/Trading Economics) | 0.75% |
| June 2026 | Highest level since September 1995 | 1.0% |
| July 30–31, 2026 | Held steady; 8–1 vote, one hawkish dissent | 1.0% |
| September 17–18, 2026 | Next meeting; markets price ~80–90% odds of a hike (as of Sep 6) | 1.25% (priced) |
Table 1. The Bank of Japan’s road from negative rates to 1 percent, 2016–2026. Units: percent per annum; dates as listed. Sources: Bank of Japan policy statements (boj.or.jp); Reuters and Trading Economics for the December 2025 step; market pricing as reported 2–6 September 2026.
The last step is telling. In July 2026, the BOJ held rates at 1.0 percent by an 8-to-1 vote, with one board member already voting for more (BOJ, July 30–31, 2026). Markets now price roughly an 80–90 percent probability of another hike, to 1.25 percent, at the next meeting on September 17–18 (market pricing reported September 2–6, 2026).
At the same time, the BOJ is quietly withdrawing its safety net. Its monthly bond purchases are scheduled to shrink from about 2.7 trillion yen to about 2.0 trillion yen by April 2027 (BOJ, June 2026). The buyer of last resort is buying less. Note what makes this cycle unusual: inflation is near, not above, the 2 percent target — headline CPI stood at 1.9 percent in July 2026 (Japan Statistics Bureau). Japan is not hiking because inflation is out of control. Japan is hiking because the yen is weak (159.97 per dollar on August 28, 2026 — Federal Reserve data), and because its government keeps spending.
September 1: The Day the Whole Curve Woke Up
The 3 percent crossing was not an isolated move in one bond. The entire Japanese curve moved on September 1, 2026:
| Tenor | Yield on September 1, 2026 | Note |
| 2-year | 1.81–1.83% | 31-year high |
| 5-year | 2.265% | Record high |
| 10-year | 3.00–3.005% | First time at 3% since September 1996 |
| 20-year | 3.885% | Highest since 1996 |
| 30-year | 4.18% | Record closing high |
Table 2. Japan’s government bond curve on September 1, 2026. Units: percent per annum, market closing levels. Source: Reuters market reports, 1 September 2026.
Every tenor woke up at once — the 2-year at a 31-year high, the 5-year at a record, the 30-year at a record closing high of 4.18 percent (Reuters, September 1, 2026). One month earlier, the government had already sold new 30-year bonds carrying a 4 percent coupon (Ministry of Finance, August 6, 2026). Japan — the country of zero — now borrows for a generation at 4 percent.
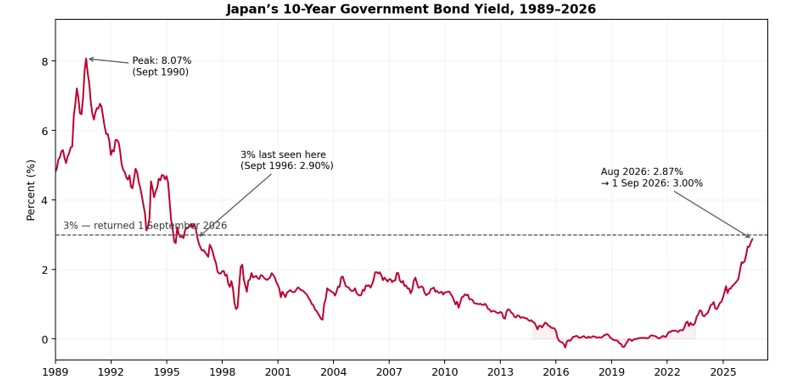
Chart 1. Japan’s 10-year government bond yield, January 1989 – August 2026. Units: percent per annum; monthly averages. Observation dates: January 1989 – August 2026, with the 1 September 2026 crossing marked. Source: ECB, ‘Japan 10 Years Government Benchmark Bond — Yield’ (monthly averages, data to August 2026); Reuters for 1 September 2026 (3.00–3.005%).
By September 4, the 10-year yield had eased to about 2.91 percent. Not because the trend changed, but because Japanese institutions stepped in to buy: a 30-year auction that day drew solid demand, with a bid-to-cover ratio of 3.79 (Reuters, September 4, 2026). High yields are painful for the borrower. They are attractive for the savers next door.
The Fiscal Arithmetic: What 3% Costs Tokyo
Here is the part that keeps Japanese officials awake. Japan’s government debt is more than twice the size of its economy — the heaviest burden among advanced nations. Its budget assumed a 3.0 percent long-term interest rate for the current fiscal year (FY2026); debt service costs already reached 31.3 trillion yen, up 10.8 percent from a year earlier — the largest jump in about two decades (Ministry of Finance figures via Reuters). For FY2027, the government raised its assumed rate to 3.8 percent, the highest in about 29 years (MOF budget request, reported August–September 2026). The Ministry of Finance’s own projection puts interest payments alone at 14.1 trillion yen in FY2027 (MOF medium-term projection).
| Item | Figure | Period / note |
| Assumed long-term interest rate in the budget | 3.0% | FY2026 (MOF figures via Reuters) |
| Assumed long-term interest rate in the budget | 3.8% | FY2027; highest in ~29 years (MOF budget request, via press) |
| Debt service cost | ¥31.3 trillion | FY2026; +10.8% year on year, largest jump in ~20 years |
| Debt service cost (previous year) | ¥28.2 trillion | FY2025 |
| Projected interest payments | ¥14.1 trillion | FY2027; 3.0% growth scenario (MOF medium-term projection) |
| Total budget requests | ~¥143 trillion | FY2027; record high (Japan Today / Kyodo) |
Table 3. Tokyo’s fiscal arithmetic around the 3 percent threshold. Units: yen, in trillions; rates in percent per annum. Sources: Japan Ministry of Finance (budget and medium-term projection documents); Reuters; Japan Today/Kyodo, August–September 2026. Note: definitions differ between budget-request and projection figures — see the Analytical Note.
The arithmetic is unforgiving because the stock is huge. Press reports put the outstanding stock of Japanese government bonds above 1,100 trillion yen. Most of that debt was issued when rates were near zero. As old bonds mature and new ones replace them at 3 percent or more, every rollover raises the interest bill. Prime Minister Sanae Takaichi’s government is simultaneously pushing record spending — FY2027 budget requests reached about 143 trillion yen, a new high (Japan Today/Kyodo, September 2026) — and promising that this is affordable. The market is now the judge.
The Quiet Repricing: When the Biggest Creditor Goes Home
The global part of this story is quieter, but larger. When Japanese yields rise, the gap between US and Japanese interest rates shrinks — and with it, the profit of lending Japanese money to the world.
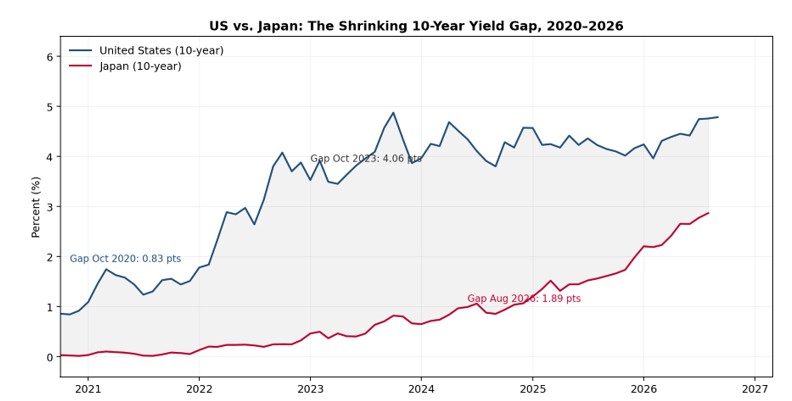
Chart 2. US and Japanese 10-year yields, October 2020 – September 2026. Units: percent per annum; monthly observations (September 2026 month-to-date for the US). The shaded area is the yield gap — the profit of the yen carry trade. Source: ECB (Japan, monthly averages to August 2026); Cboe 10-year US Treasury yield via market data.
The chart tells the whole story of the carry trade’s decline. The US–Japan 10-year gap peaked near 4 percentage points in October 2023. By August 2026 it had fallen to about 1.9 points. The engine is losing fuel.
Signs of the turn are already visible. Reuters reported that Japanese investors sold roughly 3 trillion yen of overseas bonds in 2026 as domestic yields rose, and that surveys of domestic pension funds show the highest appetite for Japanese bonds in 18 years (Reuters, September 2026). Money that spent decades leaving Japan is beginning to stay home.
This happens at a delicate moment for the United States. Its 30-year yield traded above 5 percent on 55 days this year through August 31 — the longest stretch since 2006 — reaching about 5.34 percent in mid-August, a 19-year high; a $25 billion 30-year auction on August 13 cleared at 5.216 percent, the first above 5 percent in more than 15 years (Federal Reserve data; Reuters; CNBC). The 10-year yield stood near 4.78 percent on September 4 (market data). America’s national debt is approaching $40 trillion, and its deficit for the fiscal year had reached about $1.8 trillion by July (CNBC, August 2026). The world’s largest debtor needs buyers. Its biggest traditional foreign buyer is now being paid to stay home.
Even the politics have turned. At the G20 finance meeting in Asheville (August 31 – September 1, 2026), the US Treasury Secretary publicly urged Japan to tighten policy faster — an extraordinary reversal of roles: the debtor asking the creditor to become more expensive (Euronews, September 2026). Meanwhile, energy-driven inflation is spreading: eurozone inflation jumped to 3.3 percent in August, and markets priced a European Central Bank rate hike for September 10 (Euronews, September 2026). This is a global repricing, not a Japanese accident.
What Happens Next: Three Scenarios
These are scenarios, not predictions. The evidence allows three different futures.
Scenario 1 — The orderly normalization. The BOJ hikes to 1.25 percent on September 17–18, Japanese institutions keep absorbing bonds at 3 percent and above, and the yield settles into a new, higher normal. Painful for Tokyo’s budget, manageable for the world. The September 4 auction demand supports this path.
Scenario 2 — The fiscal clash. Yields keep climbing toward the government’s own 3.8 percent assumption and beyond. The BOJ faces a choice it promised to avoid: intervene to cap rates (its “nimble response” option) or watch the interest bill explode. If the BOJ intervenes, it reverses years of credibility. If it does not, budget politics turn acute. This is the scenario of maximum tension between the fiscal state and the monetary authority.
Scenario 3 — The global spillover. Japanese money stays home in volume just as US borrowing needs peak, at a moment when energy shocks feed inflation everywhere. US long-term yields rise further, the dollar’s burden grows, and the quiet engine of the last thirty years — cheap Japanese capital — is revealed as irreplaceable. This scenario would not look like a crash. It would look like a slow, global rise in the price of trust.
The Verdict
For thirty years, Japan was called the world’s safest borrower. The phrase was misleading. Japan’s debt was never small — it was enormous. What made it safe was the interest rate: zero. Zero made the largest debt in the developed world affordable. Zero made the carry trade profitable. Zero made the whole architecture work.
Zero is gone. On September 1, 2026, the world’s largest creditor nation began paying 3 percent — and everyone who borrowed from its patience, from Tokyo insurers to Washington’s Treasury, must now pay attention. The quiet engine of global finance has changed its price.
The 3 percent number is not a Japanese problem. It is the world’s bill for thirty years of free money. And it has just arrived.
Glossary
Bond yield: The annual return a bond buyer earns if the bond is held to maturity. When bond prices fall, yields rise. A “10-year yield” means the yield on bonds maturing in ten years.
Government bond (JGB): A loan that citizens, banks and foreign investors give to the Japanese government. JGB stands for Japanese Government Bond. In return, the government pays interest.
Interest rate policy / policy rate: The interest rate a central bank sets for very short-term lending between banks. It is its main tool for making money more expensive or cheaper.
Negative interest rate policy (NIRP): A policy where the central bank charges banks for keeping money with it, to push them to lend instead. Japan ended this in March 2024.
Yield curve control (YCC): A policy where the central bank sets a target for long-term bond yields and buys bonds to keep them there, like holding a balloon under water.
Yen carry trade: Borrowing yen at very low interest and investing it in higher-yielding assets abroad. It profits from the difference between the two interest rates.
Quantitative tightening (QT): A central bank reducing the bonds it owns, instead of buying more. It is the reverse of money printing.
Bid-to-cover ratio: A measure of auction demand. It shows how many times the amount of bonds offered was covered by buyers’ orders. Higher means stronger demand.
Debt service: The annual cost of a government’s debt — interest payments plus repayment of maturing bonds.
Creditor / debtor nation: A creditor nation lends more to the world than it borrows. A debtor nation borrows more than it lends. Japan is the world’s largest creditor; the United States is the largest debtor.
Sources
Official:
- Bank of Japan — policy statements: March 2024, July 2024, June 2026, July 30–31, 2026 (boj.or.jp)
- Bank of Japan — June 2026 bond purchase schedule (boj.or.jp)
- Ministry of Finance, Japan — JGB auction results: August 4 and August 6, 2026 (mof.go.jp)
- Ministry of Finance, Japan — medium-term fiscal projection, FY2027 (mof.go.jp)
- Japan Statistics Bureau — Consumer Price Index, July 2026 (stat.go.jp, released August 2026)
- Federal Reserve — H.10 foreign exchange rates, August 28, 2026 (USD/JPY: 159.97)
- Federal Reserve data via FRED — 30-year Treasury yield (DGS30), September 3, 2026: 5.25%
- ECB — Japan 10-year government benchmark bond yield, monthly averages, 1989 – August 2026 (data.ecb.europa.eu)
- Cboe 10-year US Treasury yield, market data (September 4, 2026: 4.78%)
- G20 — Chair’s Statement, Finance Ministers and Central Bank Governors meeting, Asheville, August 31 – September 1, 2026
News (dated):
- Reuters — Japan’s 10-year JGB yield crosses 3 percent, first time since 1996 (September 1, 2026)
- Reuters — full JGB curve moves; 30-year auction demand (September 1 and September 4, 2026)
- Reuters — Japanese investors sell ~3 trillion yen of overseas bonds in 2026; pension survey (September 2, 2026)
- Reuters / CNBC — US 30-year yield 19-year high; August 13 auction at 5.216%; deficit ~$1.8 trillion; debt near $40 trillion (August 2026)
- Japan Today / Kyodo News — FY2027 budget requests ~143 trillion yen, record (September 1, 2026)
- Euronews — G20 Asheville; US Treasury Secretary urges faster BOJ tightening; eurozone inflation 3.3% (September 1–2, 2026)
- CNBC — Takaichi fiscal program; food tax cut cost estimate (May–August 2026)
Earlier article on this site: “The Last Fortress Falls: What the Bank of Japan’s Surrender Really Means” (December 27, 2025) — arzualvan.com
Analytical Note
Observation period: worldwide economic news, markets and market data from 6 August 2026 to 6 September 2026, as stated at the top of the article. This note separates what is established from what is argued.
Verified facts: the yield crossing on September 1, 2026; the BOJ rate path and purchase schedule; the MOF’s assumed rates (3.0% for FY2026, 3.8% for FY2027); budget request size; auction results; the US yield and fiscal figures cited; the G20 meeting and reported statements.
Interpretation: the framing of Japan as the world’s “quiet engine” of cheap capital and the description of the creditor–debtor loop are interpretive structures placed on verified data, not facts themselves.
Scenarios: the three futures are explicitly labeled scenarios. Nothing in the article asserts that any of them will occur.
Deliberately excluded because they could not be verified with primary sources in the observation window: precise figures for Japan’s US Treasury holdings (TIC data), Japan’s FX reserves, and the size of carry-trade positions. Where only single-source press figures existed (e.g., the 3 trillion yen foreign-bond selling figure), they are attributed to that source in the text.
One fiscal conflict was found and is disclosed here: press reports put FY2027 debt service at about 36.6 trillion yen (budget-request definition, including redemptions), while the MOF’s medium-term projection shows 33.1 trillion yen under a 3.0% growth scenario. These measure different scopes. The article therefore uses the MOF’s interest-payments-only figure (14.1 trillion yen) and the assumed-rate signal (3.8%), and does not present either debt-service total as the definitive number.
The analytical frameworks used for indicator selection follow the editorial policy of this site: monetary-system cycle analysis, and the distinction between a currency and a store of value. No external analyst is named or quoted, by design.