
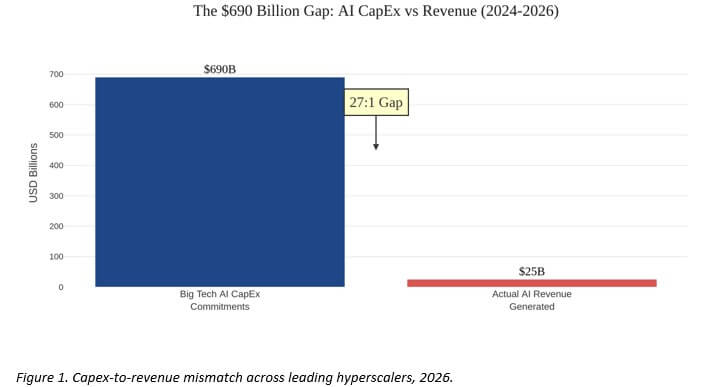
Here is the simplest way to describe what is happening in the global AI economy right now. Imagine a city of one million people ordering food through a new app. The app company spends hundreds of billions building kitchens, warehouses, and delivery fleets. Then you discover the app has only sold twenty-five million dollars’ worth of meals. That is the AI infrastructure story of 2026. The world’s biggest technology companies have committed somewhere between $660 billion and $750 billion in capital spending on AI infrastructure for this year alone [1] [2], while the revenues that should justify this spending remain a fraction of the outlay.
This is not simply overenthusiasm. It is the meeting point of financial fiction and physical reality. You cannot print electricity. You cannot borrow your way past thermodynamics. When semiconductor stocks lost approximately $1.3 to $1.4 trillion in market value in a single week in June 2026 [3] [4], and when OpenAI — the company that is supposed to be the great revenue engine of the AI age — reported an adjusted operating margin of negative 122% in the first quarter of 2026 [5] [6], the market began to understand what physicists and power engineers had known for years: the laws of nature do not participate in funding rounds.
This article traces the anatomy of that collision. It connects the financial architecture of AI spending with energy grids, semiconductor supply chains, monetary policy, and the broader fragility of a dollar-based global monetary system that is visibly fraying at the edges. The conclusion is uncomfortable but necessary: the AI infrastructure bubble may be the terminal chapter of a four-decade monetary experiment built on cheap debt, and the signals of systemic fracture are now measurable, not theoretical.
Bottom line for decision-makers: The gap between AI capital spending and AI revenue is not a timing problem waiting to be solved. It is a structural impossibility at current energy, debt, and revenue ratios. Investors, policymakers, and institutions should treat AI infrastructure exposure as a systemic risk category — not a growth opportunity — until the physics of power delivery and the arithmetic of cash flow are reconciled.
Key Findings
- The capex-revenue gap is a 27-to-1 mismatch at system level. The five largest hyperscalers — Amazon, Alphabet, Microsoft, Meta, and others — are collectively deploying roughly $660 billion to $750 billion in AI infrastructure capital in 2026 [1] [2], while OpenAI, the sector’s flagship revenue generator, reported an annualized revenue run rate of approximately $25 billion as of early 2026 [7] [8]. So what: The mathematics of return on investment at this ratio are not credible within any conventional business cycle. Decision-makers must ask who bears the loss when the harvest never arrives.
- OpenAI is burning money at an industrial scale with no clear path to profitability before 2030. OpenAI recorded $5.7 billion in Q1 2026 revenue against an operating loss of approximately $6.95 billion, a negative margin of 122% [5] [6]. Internal projections suggest cumulative losses could reach $115 billion through 2029 before sustained profitability arrives [9] [10]. So what: The company that serves as the revenue justification for hundreds of billions in cloud investment is itself a profound loss-making operation. The entire ecosystem rests on a foundation of circular spending.
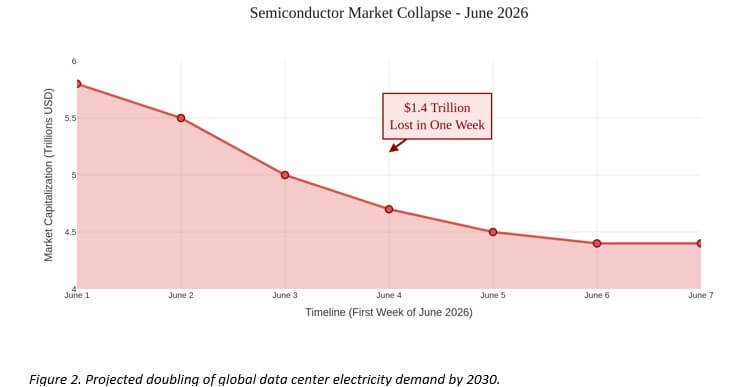
- Semiconductors lost $1.3 to $1.4 trillion in market value in a single June 2026 session. The Philadelphia Semiconductor Index fell more than 10% in one trading day on June 5, 2026, triggered by Broadcom’s quarterly earnings, where AI networking revenue came in at $4.1 billion against analyst expectations of $4.8 billion [11] [4]. So what: Markets were priced for perfection with many semiconductor stocks trading at price-to-earnings multiples of 50x to 100x [4] [11]. Even a small miss triggers catastrophic valuation resets.
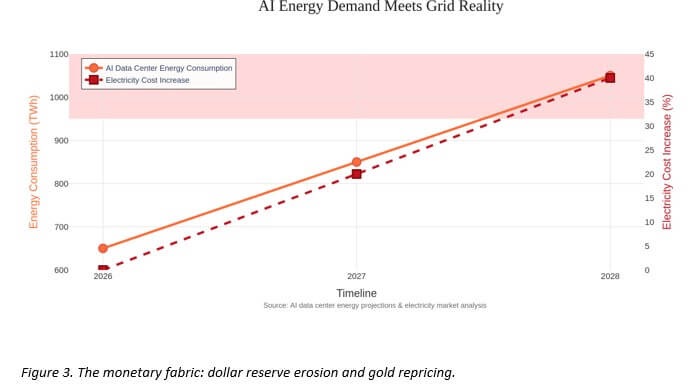
- Energy has become the binding physical constraint on AI infrastructure. Global data center electricity consumption is projected to nearly double from 485 TWh in 2025 to approximately 950 TWh by 2030 [12] [13]. In the United States alone, data centers could consume between 325 TWh and 580 TWh by 2028 [14] [15]. So what: You cannot build more AI without building more power capacity first — and power grids take seven to eleven years to expand [16]. The bottleneck is not software or chips. It is physics.
- Meta’s July 1, 2026 announcement signaled that the GPU scarcity era may be ending. Meta announced plans to rent out its excess AI computing capacity to external developers — a service internally called “Meta Compute” — on July 1, 2026 [17] [18]. Neocloud providers CoreWeave and Nebius fell 10 to 12% on the news [17]. So what: When you have so much compute that you need to sell it to others, the premise of permanent scarcity — which justified premium GPU pricing — is broken.
- China export controls have cost Nvidia roughly $3.5 to $4 billion in annual revenue. U.S. restrictions, combined with Beijing’s active discouragement of American chip purchases, have caused Nvidia’s market share in China to fall from approximately 95% to near zero [19]. Huawei’s competing Ascend 950PR chip entered mass production in March 2026 [19]. So what: Export controls intended to slow China have instead accelerated domestic Chinese AI development while permanently removing a major revenue source for U.S. chipmakers.
- The dollar-based monetary system is visibly transitioning. The Bank for International Settlements reports that the dollar’s share of global foreign exchange reserves fell from 62% in 2012 to 57% in 2025 [20] [21]. Geoeconomic fragmentation is forcing regions to build local-currency financial frameworks [20]. So what: The AI spending boom has been partially funded by the privilege of dollar-denominated debt issuance. As that privilege erodes, the cost of sustaining the infrastructure build-out rises.
The Capex Mountain and the Revenue Molehill
What the Numbers Actually Say
Think of capital expenditure as planting seeds. The question is always: how many seeds, on what kind of soil, in what season? In 2026, the world’s largest technology companies are planting seeds at a rate never seen in human economic history.
| Company | 2026 Capex Guidance | Key AI Revenue Metric |
| Amazon | $200 billion [22] [23] | AWS growing 28% YoY; free cash flow dropped 95% to $1.2B [24] |
| Alphabet | $180–190 billion [25] [26] | Google Cloud: $20B/quarter, backlog $460B+ [27] |
| Microsoft | ~$190 billion [28] [29] | AI business: $37B annual run rate, 123% YoY growth [30] [31] |
| Meta | $125–145 billion [32] [33] | Revenue $56.3B/quarter; stock fell 6–7% on capex news [34] [35] |
| OpenAI (spend) | ~$600B cumulative by 2030 [36] | $5.7B Q1 2026 revenue; -122% operating margin [5] [6] |
Table 1. 2026 AI capex commitments and key revenue metrics for major hyperscalers. Sources: [22]–[36].
Amazon’s free cash flow — the actual money left over after spending — dropped 95% to just $1.2 billion as capital investments absorbed operating cash [24]. That is a company reporting $30 billion in quarterly net income while nearly running out of freely deployable cash. Microsoft explicitly warned investors that these investments “may decrease operating margins” [37]. Meta’s stock fell after its earnings call precisely because investors were alarmed by the capex revision, not impressed by the 33% revenue growth [32] [35].
The aggregate picture, as flagged by financial stability monitors, is that these companies may issue as much as $1.5 trillion in new debt over the coming years to sustain the build-out [38]. This is debt-fueled infrastructure spending at a scale that makes the 2000s housing construction boom look modest.
The core problem: Revenue is growing. But capex is growing faster. And the debt required to bridge that gap is growing fastest of all. At some point, the math stops working regardless of how good the technology is.
Chart 1 — Capex vs. Revenue Gap (Placeholder)
The OpenAI Paradox
OpenAI is the most important company in this story, not because it is the most successful financially — it is not — but because its finances reveal the structural impossibility at the heart of the AI economy.
In 2025, OpenAI generated $13.07 billion in revenue. Its total costs and expenses were $34 billion. Its net loss was $38.5 billion [39] [40]. Think about that: for every dollar of revenue, the company spent roughly $2.60. In Q1 2026, with $5.7 billion in revenue and an operating loss of approximately $6.95 billion, the ratio barely improved [5] [6].
Weekly active users averaged 905 million in the first quarter of 2026, missing the internal goal of reaching 1 billion [6]. OpenAI has committed $250 billion to Microsoft’s Azure cloud services [7]. It raised $122 billion in March 2026 at a valuation of approximately $852 billion [41]. It filed confidentially for an IPO in June 2026, aiming for a valuation exceeding $1 trillion [7].
The company burning the most money is simultaneously valued as if it has already won.
So what: One analysis has described this arrangement as a “financial ouroboros” — a snake eating its own tail — where hyperscalers invest in AI companies, which spend those funds back on hyperscaler cloud services, creating a loop of reported revenue that may mask the absence of genuine, broad-based economic demand [42]. The BIS has identified AI-related debt concentration as a significant systemic financial risk [43] [44].
The Semiconductor Shock of June 2026
A Trillion-Dollar Lesson in Expectations
On June 3, 2026, Broadcom reported quarterly earnings that would have been considered outstanding by any historical standard. AI chip revenue was up 143% year-over-year, reaching $10.8 billion [11]. But the company’s AI networking segment came in at $4.1 billion — below the analyst expectation of $4.8 billion [11]. CEO Hock Tan maintained, rather than raised, the company’s 2027 AI semiconductor outlook [11] [45].
That was enough to detonate the sector.
| Company | Single-Day Decline | Approximate Market Cap Loss |
| Philadelphia Semiconductor Index | -10% [4] [11] | Systemic |
| Broadcom | -12.6% to -15% [4] [2] | — |
| Intel | -11.28% to $99.17 [45] [11] | — |
| AMD | -10.86% to $466.38 [45] [11] | — |
| Marvell Technology | -17% [11] [4] | — |
| Nvidia | ~-6% [11] | ~$279B–$740B [11] [4] |
| Sector Total | — | ~$1.3–$1.4 trillion [3] [4] |
Table 2. Semiconductor sector single-session declines, June 5, 2026. Sources: [2]–[4], [11], [45].
The speed and breadth of the decline reflected something important: these stocks had been priced for perfect, exponential, uninterrupted growth, with many trading at price-to-earnings multiples of 50x to 100x [4] [11]. When perfection even slightly disappoints, the fall is violent.
Macroeconomic factors amplified the shock. A strong U.S. jobs report increased fears that the Federal Reserve would keep interest rates higher for longer [11] [46]. Higher interest rates hurt high-growth, high-multiple stocks disproportionately because they raise the discount rate applied to future earnings. Rising geopolitical tensions pushed oil prices above $97 per barrel [11] [47], adding cost pressure to energy-intensive chip manufacturing.
The structural warning: When stocks priced for perpetual exponential growth meet a single quarter of “merely excellent” results, the correction is not a blip. It is the market repricing the probability that the exponential growth story was fiction.
The Physical Wall: Energy, Heat, and Grid Reality
Why You Cannot Solve This With More Money
Here is the simplest way to understand the energy problem. Modern AI chips — like Nvidia’s GB200 NVL72 — generate enormous amounts of heat when running. A single rack of these chips can require 100 to 140 kilowatts of power [48]. Traditional data centers were designed for 10 to 20 kilowatts per rack. The physics do not negotiate.
This means you cannot simply upgrade software or raise more capital to solve the problem. You must physically rebuild the infrastructure from the ground up — new cooling systems, new power delivery, new grid connections. That takes time. A lot of time.
Global data center electricity projections:
| Year | Global Consumption | AI-Specific Servers |
| 2024 | ~415 TWh [49] [50] | 53–76 TWh [51] |
| 2025 | ~485 TWh [12] | Growing 50% YoY [13] |
| 2028 | (U.S. alone: 325–580 TWh) [15] [14] | 165–326 TWh [51] |
| 2030 | ~950 TWh globally [12] [13] | Triple 2025 levels [13] |
Table 3. Global data center electricity consumption trajectory, 2024–2030. Sources: [12]–[15], [49]–[51].
Chart 2 — Data Center Electricity Demand (Placeholder)
Power interconnection queues in the United States now contain approximately 2,300 gigawatts of generation and storage capacity waiting for grid connection — more than the entire installed power capacity of the country [16]. Projects wait an average of five years to connect [16]. Transmission line permitting takes seven to eleven years [16]. You cannot build AI faster than you can build power lines.
In the PJM Interconnection — the 13-state grid that covers much of the U.S. Eastern Seaboard — data center growth has driven capacity prices to record highs [52] [53] [54]. A 2027/2028 capacity auction already fell short of the reliability requirement by 6,623 MW [55] [56].
The AI sector is simultaneously the largest new source of electricity demand and the most inflexible consumer — AI data centers run at high, constant loads and cannot easily reduce consumption during peak hours [57] [58]. In Northern Virginia, a single voltage fluctuation once created a 1,500 megawatt surplus event that required emergency grid adjustments [14]. These are not software problems.
So what: Energy access has replaced chip supply as the primary constraint on AI infrastructure deployment. Companies that secure reliable, affordable power sources first will hold an insurmountable structural advantage. Companies that do not may find their expensive data centers are simply warehouses full of chips they cannot power.
The Fed cannot fix this: Central bank liquidity can solve funding problems. It cannot solve physics problems. No amount of quantitative easing extends the reach of a power grid.
Meta’s Surprise: When Surplus Compute Becomes a Business
On July 1, 2026, reports emerged that Meta Platforms was developing a cloud infrastructure service — internally called “Meta Compute” — to rent its excess AI computing capacity to external developers [17] [18]. The company is considering two models: selling API access to its hosted AI models (like AWS Bedrock), or renting raw GPU capacity (like neocloud providers) [17] [59] [18].
Meta’s stock rose 8.8% to 10% on the news [17] [60]. CoreWeave fell over 10%. Nebius fell over 12% [17].
Read that signal carefully. When a company building $125 to $145 billion in AI infrastructure [32] [33] announces it has too much compute to use internally and needs to sell it to others, the market for scarce GPU compute is structurally challenged. The scarcity narrative — which justified premium pricing for specialized cloud providers — begins to dissolve.
This mirrors a broader dynamic noted by market analysts: the anticipated “compute surplus” environment is beginning to replace the “compute scarcity” era [61] [62]. When the largest builder decides to become a seller, the market changes fundamentally.
So what: Meta’s announcement is not merely a business pivot. It is a price signal. The AI infrastructure buildout has been so aggressive that even the largest consumers are producing excess capacity. That excess will compress margins across the specialized cloud sector.
China Export Controls and the Self-Defeating Strategy
The United States implemented export controls on advanced AI chips to slow China’s AI development. The result, according to the research data, has been more complicated than intended.
Nvidia’s market share in China has fallen from approximately 95% to near zero [19]. This represents a potential annual revenue loss of $3.5 billion to $4 billion for Nvidia [19]. Simultaneously, Huawei’s Ascend 950PR AI chip entered mass production in March 2026, and the company is targeting $12 billion in AI chip sales for 2026 — a 60% year-over-year increase [19]. SMIC is expanding foundry capacity, adding 40,000 monthly wafers by year-end 2026 [19].
The controls have additionally introduced a new vulnerability: China controls the export of indium phosphide, a critical material for high-speed AI data center components, creating a counter-pressure point of international tension [63] [64].
So what: Export controls have simultaneously removed a major U.S. revenue source and catalyzed the very domestic Chinese AI capability the controls were designed to prevent. This is a geopolitical and commercial miscalculation with consequences that compound annually.
Capital Flight, Gold, and the Fraying Monetary Fabric
The BIS reports that the dollar’s share of global foreign exchange reserves has declined from 62% in 2012 to 57% in 2025 [20] [21]. This is not a sudden collapse. It is a slow-moving structural shift driven by geoeconomic fragmentation, rising U.S. federal debt, and the deeply negative U.S. net foreign asset position [21].
Asian economies are accelerating the development of regional financial architectures — cross-border payment linkages and currency frameworks designed to buffer against “weather set elsewhere,” meaning dollar-liquidity stress [20]. The IMF projects global growth will slow to 3.1% in 2026, with downside risks dominated by further fragmentation [65].
In precious metals markets, institutional gold price forecasts for 2026 range as high as $6,000 to $6,300 per ounce [66]. The long-term drivers cited include persistent record-level debt-to-GDP ratios in Western economies, sustained central bank gold accumulation, and what some analysts describe as accelerated de-dollarization [67] [66]. The AI infrastructure build-out is being financed with projections suggesting up to $1.5 trillion in new hyperscaler debt issuance [38] — precisely the kind of debt accumulation that historically drives capital toward non-sovereign stores of value.
The deeper connection: The AI bubble and the monetary system transition are not separate stories. Cheap debt enabled the AI spending boom. The spending boom requires ever more debt. The debt accumulation weakens confidence in dollar-denominated assets. Weakened dollar confidence accelerates capital flows toward gold and alternatives. The AI bubble, in this reading, is both a product of the monetary system’s excess and a potential accelerant of its unraveling.
Chart 3 — Dollar Reserve Share & Gold Forecast (Placeholder)
The US-China AI Race: Geopolitics Meets Balance Sheet Reality
The AI race between the United States and China is creating two increasingly incompatible technology stacks [68]. The U.S. maintains leadership in frontier AI models, capital deployment, and talent. China has focused on cost-optimized models and rapid domestic adoption, accelerated by state subsidy and the forced removal of American hardware from its supply chain [68] [19].
The competition is not merely technological. It is a contest over which monetary and geopolitical system organizes the global economy in the decades ahead. AI infrastructure has become the physical embodiment of dollar superiority — the narrative that American capital, American chips, and American cloud platforms will define the next industrial revolution.
The problem is that the narrative now runs into arithmetic. AI is highly capital-intensive [69]. The U.S. growth fueled by AI infrastructure investment is real [69]. But that investment is being financed with debt, at interest rates kept elevated by the same inflationary pressures the energy-intensive AI buildout helps create [43]. The BIS notes that as AI diffusion collides with infrastructure bottlenecks, energy constraints are beginning to blur the lines between industrial policy and macroeconomic management, “potentially anchoring higher core inflation and creating localized overheating” [69].
The Federal Reserve cannot lower rates to help the AI sector without risking inflation. It cannot raise rates to fight inflation without crushing the debt-financed AI build-out. It is a trap of its own design.
Recommendations
- Investors and portfolio managers: Reprice AI infrastructure exposure as a systemic risk category. The 27-to-1 gap between AI capex commitments and realized AI revenues [1] [7], combined with OpenAI’s -122% operating margin [5] [6], creates conditions in which current valuations in AI-adjacent equities are structurally unsustainable. Reduce concentration in semiconductor and specialized cloud companies with P/E multiples above 50x. The June 2026 selloff [3] [4] demonstrates how rapidly this repricing can occur.
- Energy policymakers and grid operators: Treat data center load growth as a national infrastructure emergency. Utility forecasts show data centers accounting for approximately 55% of projected peak demand growth [70]. PJM’s 2027/2028 capacity auction already showed a 6,623 MW shortfall [55] [56]. Governments should prioritize grid expansion with the same urgency as any major industrial mobilization. The seven-to-eleven year timeline for transmission expansion [16] is incompatible with the two-to-three year timeline of AI deployment cycles.
- Corporate treasurers at AI-dependent firms: Stress-test for a prolonged high-rate environment. The BIS’s identification of AI-related debt concentration as a systemic risk [43] [44] and the Federal Reserve’s higher-for-longer posture [11] mean that the cost of carrying $1.5 trillion in projected new hyperscaler debt [38] is rising. Companies should model operating scenarios where Fed rates remain above 4.5% through 2028 and where AI revenue growth falls 30-40% below base case.
- Governments designing AI trade policy: Audit the second-order consequences of export controls. The China chip export controls have reduced Nvidia’s China revenue by an estimated $3.5 to $4 billion annually [19] while accelerating Huawei’s domestic chip production to a targeted $12 billion in 2026 sales [19]. Any future export control expansion should be evaluated against the demonstrated pattern: controls accelerate the very domestic capability they seek to prevent, while permanently removing revenue from U.S. companies.
- Long-term institutional asset allocators: Increase exposure to assets that benefit from monetary system fragility. The BIS documents the dollar’s declining reserve share [20] [21]. Gold price forecasts from multiple institutions reach $6,000 to $6,300/ounce [66], driven by central bank accumulation and de-dollarization dynamics. For institutions with multi-decade mandates, a structural allocation to precious metals as a hedge against dollar-system fragility is now supported by documented reserve data, not merely theoretical concern.
Caveats & Limitations
The GPU rental price discrepancy. The preliminary research data provided with this report’s brief suggested a 31% drop in B200 GPU rental prices in June 2026. The actual web search data tells the opposite story. As of June-July 2026, B200 median on-demand prices were approximately $6.11/hour [71], with prices having surged approximately 24% in March 2026 [72]. Supply for modern GPUs remained tight through mid-2026 [73]. This report relies on the verified web search data, not the preliminary figures. Readers should note this contradiction.
Revenue figures are contested. OpenAI’s revenue run rate is reported variously as $20 billion [41], $24 billion [41], and $25 billion [7] [8] in different sources. This likely reflects different measurement periods and methodologies. The operating loss figures (negative 122% margin [5] [6]) are cited from Reuters and are treated as the most reliable single-source figure.
Capex totals involve some estimation. The aggregate figure of $660-750 billion [1] [2] for 2026 AI infrastructure spending consolidates guidance from multiple companies at different reporting dates. Individual company guidance has already been revised upward mid-year [25] [26]. The true full-year figure may exceed these estimates.
GPU pricing data is highly fragmented. Price comparisons across hyperscalers and neocloud providers vary by 3x to 6x for identical hardware [71] [74], making sector-wide averages misleading. The figures cited represent median market estimates from specialized tracking services, not official exchange prices.
Gold price forecasts are institutional estimates, not verified outcomes. The $6,000-$6,300/oz forecast [66] represents the upper end of institutional projections and carries significant uncertainty. Short-term gold prices have shown sensitivity to Fed rhetoric and geopolitical events [75] [67].
Dollar reserve share data lags by design. The BIS figure of 57% dollar share in 2025 [20] [21] reflects reported reserve compositions, which are often disclosed with delays. The actual current figure may differ.
Energy demand projections carry wide uncertainty bands. The IEA presents a range from 700 to 1,700 TWh by 2035 depending on AI adoption speed and efficiency gains [49]. The 950 TWh by 2030 figure is a central case, not a certainty. Hardware efficiency improvements could narrow the gap between the scenarios.
Glossary
Agentic AI: AI systems that take actions, make decisions, and complete multi-step tasks on their own, rather than simply answering questions. Think of a smart assistant that doesn’t just give you a recipe but also shops for ingredients, books the delivery, and adjusts the timing when your meeting runs long.
B200 / H100 / Blackwell / Hopper: These are model names for Nvidia’s computer chips (GPUs) designed specifically for AI work. The H100 (Hopper family) is older; the B200 (Blackwell family) is newer and more powerful. The names come from physicists: David Hilbert and David Blackwell.
BIS (Bank for International Settlements): The central bank of central banks. It is based in Basel, Switzerland, and produces influential research on global financial stability. When the BIS flags a risk, every major economy’s financial regulator pays attention.
Capex (Capital Expenditure): Money a company spends on big physical assets — buildings, machines, equipment — that it expects to use for many years. Different from regular operating costs like salaries or electricity bills. Think of it as buying a house versus paying rent.
Central bank digital currencies (CBDCs): Digital versions of national currencies, issued directly by central banks. Like the dollar, but existing only as computer code rather than paper or coins.
CoWoS packaging: An advanced manufacturing technique (Chip on Wafer on Substrate) used to connect AI chips to their high-speed memory. There is a global shortage of this packaging capacity, limiting how fast new AI chips can be produced.
De-dollarization: The process by which countries, companies, and central banks gradually reduce their reliance on the U.S. dollar for international trade, savings, and reserves. Not a sudden switch, but a slow shift toward using other currencies or gold.
Discount rate: In finance, the interest rate used to calculate what future money is worth today. Higher rates mean future earnings are worth less now. This is why rising interest rates particularly hurt high-growth tech stocks — their profits are expected far in the future.
DRAM / NAND / HBM3e: Types of computer memory. DRAM and NAND are familiar types. HBM3e (High Bandwidth Memory) is a specialized, ultra-fast type of memory stacked directly onto AI chips. There is a structural global shortage of HBM3e, which limits AI chip production.
EPS (Earnings Per Share): A company’s profit divided by the number of shares outstanding. It tells you how much profit each share of stock “earned.” Higher EPS generally means a more profitable company.
Fed / Federal Reserve: The central bank of the United States. It sets short-term interest rates, which influence borrowing costs across the entire global financial system because so much debt is denominated in dollars.
Financial ouroboros: A metaphor from mythology (a snake eating its own tail). In this context, it describes a circular financial arrangement where the same money goes around in a loop — hyperscalers invest in AI companies, AI companies spend on hyperscaler services, hyperscalers report that as revenue — without generating new genuine economic activity.
Fiat currency: Money whose value comes from government declaration rather than a physical commodity like gold. Every major currency today — the dollar, euro, yuan — is fiat currency.
FLOPs / FLOPs per Watt: FLOP stands for Floating Point Operation — essentially one unit of mathematical calculation. FLOPs per Watt measures how many calculations a chip can do per unit of electricity. Higher is more efficient.
Free cash flow: The actual cash a company has left over after paying all its bills and making its capital investments. This is the money available to pay dividends, buy back stock, or fund new projects. More reliable than “profit” as a measure of financial health.
Geoeconomic fragmentation: The process by which the global economy is splitting into rival blocs organized around geopolitical alliances rather than pure economic efficiency. Countries trade less with rivals and more with allies, even when trading with rivals would be cheaper.
GPU (Graphics Processing Unit): A type of chip originally designed for video games, which proved extraordinarily good at the kind of math required for AI training. The global scramble for Nvidia’s GPUs is a central storyline of the current AI boom.
Hyperscaler: A very large cloud computing company that operates data centers at a global scale — think Amazon Web Services, Microsoft Azure, Google Cloud. They rent computing power to other businesses.
IEA (International Energy Agency): An intergovernmental organization based in Paris that produces authoritative research on global energy trends, supply, and policy.
IMF (International Monetary Fund): A global financial institution that monitors economic trends, makes loans to countries in financial difficulty, and produces the most widely cited global growth forecasts.
Inference / Training: AI chips do two types of work. Training teaches a model by processing enormous datasets — very energy intensive. Inference is running the trained model to answer questions or generate content — what happens when you type into ChatGPT.
Interconnection queue: The waiting list of energy projects (power plants, wind farms, solar arrays) that need to connect to the electrical grid. The U.S. queue contains more capacity than the entire country’s installed power base.
LLM (Large Language Model): The technology behind AI chatbots like ChatGPT. An LLM is trained on vast amounts of text and learns to predict and generate language. “Large” refers to the billions of parameters (adjustable settings) in the model.
Neocloud: A newer category of cloud computing company that rents out raw GPU computing power, often at lower prices than the big hyperscalers. Examples include CoreWeave, RunPod, and Lambda Labs.
Net Foreign Asset Position: The total value of what a country’s residents own abroad minus what foreigners own in that country. The U.S. has a deeply negative position, meaning foreigners own far more in America than Americans own abroad.
Operating margin: Operating profit divided by revenue, expressed as a percentage. It tells you how much of each dollar of revenue becomes operating profit. A -122% operating margin means the company loses $1.22 for every $1 it earns.
Petrodollar system: The arrangement, dominant since the 1970s, where oil is priced and traded globally in U.S. dollars. This created structural demand for dollars worldwide, underpinning American monetary power. This system is under increasing strain as alternative trading arrangements emerge.
PJM Interconnection: A regional electric transmission organization that manages the power grid for 13 U.S. states and Washington D.C., covering about 65 million people. It is the world’s largest competitive wholesale electricity market.
Price-to-Earnings (P/E) multiple: A stock’s price divided by its earnings per share. A P/E of 50x means investors are paying $50 for every $1 of current annual earnings. The higher the P/E, the more investors are betting on future growth. At 100x, even a modest disappointment can cause catastrophic price declines.
Run rate: An estimate of annual performance based on current data. If a company earns $5 billion in one quarter, its “annualized run rate” is $20 billion — even though that number hasn’t been officially recorded yet.
Stagflation: A combination of high inflation and slow economic growth. This is especially dangerous because the normal remedy for high inflation (raising interest rates) can worsen the slow growth, and vice versa.
Strait of Hormuz: A narrow waterway between Iran and the Arabian Peninsula through which roughly 20% of the world’s oil supply flows. A blockade here — as occurred in the February 2026 conflict referenced in BIS data — can severely disrupt global energy markets.
Stablecoin: A type of digital currency designed to maintain a stable value, usually pegged to the U.S. dollar. Used in cryptocurrency markets as a less volatile medium of exchange.
Tokenization: In finance, the process of creating a digital representation (a “token”) of a real-world asset — like real estate, bonds, or commodities — on a blockchain. It allows fractional ownership and faster settlement.
TWh (Terawatt-hour): A unit of energy. One terawatt-hour is enough electricity to power approximately 90,000 average American homes for a year. Global data centers used about 415 TWh in 2024 — equivalent to powering the entire United Kingdom for a year.
This article was prepared for arzualvan.com. All data is sourced from research collected through July 5, 2026. Economic projections involve inherent uncertainty and should not be construed as investment advice.
References
[1] https://futurumgroup.com/insights/ai-capex-2026-the-690b-infrastructure-sprint/
[2] https://intellectia.ai/blog/chip-stocks-pullback-june-2026
[3] https://www.reuters.com/business/media-telecom/chip-selloff-erases-over-1-trillion-stock-market-value-2026-06-05
[4] https://intellectia.ai/blog/ai-semiconductor-selloff-june-2026
[5] https://www.reuters.com/business/openai-burned-37-billion-first-quarter-2026-information-reports-2026-06-16/
[6] https://www.wheresyoured.at/news-openai-had-a-negative-122-operating-margin-in-q1-2026-and-chatgpt-growth-has-stalled/
[7] https://sacra.com/c/openai/
[8] https://www.reuters.com/technology/openai-tops-25-billion-annualized-revenue-last-month-information-reports-2026-03-05/
[9] https://finance.yahoo.com/news/openais-own-forecast-predicts-14-150445813.html
[10] https://www.rdworldonline.com/facing-14b-losses-in-2026-openai-is-now-seeking-100b-in-funding-but-can-it-ever-turn-a-profit/
[11] https://intellectia.ai/blog/semiconductor-stocks-selloff-june-2026
[12] https://www.iea.org/reports/key-questions-on-energy-and-ai/executive-summary
[13] https://www.iea.org/news/data-centre-electricity-use-surged-in-2025-even-with-tightening-bottlenecks-driving-a-scramble-for-solutions
[14] https://www.belfercenter.org/research-analysis/ai-data-centers-us-electric-grid
[15] https://www.brookings.edu/articles/global-energy-demands-within-the-ai-regulatory-landscape/
[16] https://www.hanwhadatacenters.com/blog/data-center-grid-limitations-the-power-bottleneck/
[17] https://www.tomshardware.com/tech-industry/meta-reportedly-plans-to-rent-out-its-ai-compute
[18] https://windowsforum.com/threads/meta-ai-cloud-plans-hosted-models-and-gpu-rental-threaten-hyperscalers.432981/
[19] https://www.linkedin.com/posts/robertquinn2020_semiconductor-ai-nvidia-activity-7461747366044348416-rfk0
[20] https://www.bis.org/review/r260223d.htm
[21] https://www.bis.org/review/r251211c.pdf
[22] https://www.levelheadedinvesting.com/p/amazon-q4-2025-earnings-and-2026-outlook
[23] https://phemex.com/academy/amazon-amzn-stock-2026
[24] https://www.investing.com/news/company-news/amazon-q1-2026-slides-aws-surges-28-record-margins-offset-by-capex-93CH-4647447
[25] https://www.cnbc.com/2026/04/29/alphabet-googl-q1-2026-earnings.html
[26] https://www.heygotrade.com/en/blog/alphabet-q1-2026-earnings-reaction/
[27] https://abc.xyz/investor/events/event-details/2026/2026-Q1-Earnings-Call-2026-nW8kCrBAKS/default.aspx
[28] https://www.cnbc.com/2026/04/29/microsoft-msft-q3-earnings-report-2026.html
[29] https://www.globaldatacenterhub.com/p/microsoft-q3-fy2026-the-190b-capex
[30] https://www.microsoft.com/en-us/investor/earnings/fy-2026-q3/press-release-webcast
[31] https://www.microsoft.com/en-us/investor/events/fy-2026/earnings-fy-2026-q3
[32] https://fortune.com/2026/04/29/meta-zuckerberg-145-billion-ai-spending-roi/
[33] https://coindcx.com/blog/us-stock/meta-q1-2026-earnings-results/
[34] https://investor.atmeta.com/investor-news/press-release-details/2026/Meta-Reports-First-Quarter-2026-Results/default.aspx
[35] https://www.stocktitan.net/sec-filings/META/8-k-meta-platforms-inc-reports-material-event-a1f8567f3401.html
[36] https://www.reuters.com/technology/openai-sees-compute-spend-around-600-billion-by-2030-cnbc-reports-2026-02-20/
[37] https://www.microsoft.com/investor/reports/ar25/index.html
[38] https://introl.com/blog/hyperscaler-capex-600b-2026-ai-infrastructure-debt-january-2026
[39] https://www.wheresyoured.at/exclusive-openai-financials/
[40] https://fortune.com/2026/06/16/openai-financials-leaked-losses-revenue-profit/
[41] https://aibusinessweekly.net/p/openai-statistics
[42] https://nooneshappy.com/article/the-ai-bubble/
[43] https://www.bis.org/publ/arpdf/ar2026e1.htm
[44] https://www.bis.org/publ/qtrpdf/r_qt2603.pdf
[45] https://www.kavout.com/market-lens/what-triggered-the-recent-semiconductor-sell-off
[46] https://www.heygotrade.com/en/news/semiconductor-selloff-nvidia-chip-rebound/
[47] https://intellectia.ai/blog/tech-stock-pullback-june-2026
[48] https://arxiv.org/html/2509.07218v3
[49] https://www.iea.org/reports/energy-and-ai/energy-demand-from-ai
[50] https://incorrys.com/data-centers/power-consumption-of-data-centers/
[51] https://aimultiple.com/ai-energy-consumption
[52] https://www.reuters.com/business/energy/prices-biggest-us-power-grid-auction-hit-new-record-supply-crunch-2025-12-17/
[53] https://www.reuters.com/business/energy/us-grid-rules-faster-data-centers-favor-on-site-gas-plants–reeii-2026-01-27/
[54] https://www.powerpolicy.net/p/data-centers-could-make-or-break
[55] https://insidelines.pjm.com/pjm-auction-procures-134479-mw-of-generation-resources/
[56] https://www.pjm.com/-/media/DotCom/about-pjm/newsroom/2025-releases/20251217-pjm-auction-procures-134479-mw-of-generation-resources.pdf
[57] https://nzero.com/blog/u-s-power-demand-hits-new-highs-driven-by-data-centers-ai-and-grid-constraints/
[58] https://www.forbes.com/councils/forbesbusinesscouncil/2025/12/08/ai-grid-constraints-and-the-real-power-crisis-facing-data-centers/
[59] https://gizmodo.com/meta-goes-the-way-of-xai-considers-renting-computing-power-as-own-model-flails-2000780274
[60] https://news.ainvest.com/deep-topic/topic/meta-to-sell-ai-computing-power-2607
[61] https://windowsforum.com/threads/meta-compute-2026-could-rent-spare-ai-gpus-is-meta-joining-aws-azure.433507/post-995131
[62] https://en.bloomingbit.io/feed/news/115474
[63] https://www.reuters.com/world/china/chinas-control-over-indium-phosphide-exports-threatens-ai-data-centre-rollout-2026-06-11/
[64] https://www.instagram.com/p/DZZW5OBEiTG/
[65] https://www.imf.org/en/publications/weo/issues/2026/04/14/world-economic-outlook-april-2026
[66] https://www.sbcgold.com/gold-price-forecasts/gold-price-forecast-2026/
[67] https://www.cmegroup.com/insights/economic-research/2026/do-retreating-precious-metals-prices-offer-a-buying-opportunity.html
[68] https://www.bcg.com/publications/2026/us-and-china-ai-strategy-causing-global-ai-divide
[69] https://www.imf.org/en/publications/fandd/issues/2026/03/point-of-view-ai-can-lift-global-growth-marcello-estevao
[70] https://gridstrategiesllc.com/wp-content/uploads/Grid-Strategies-National-Load-Growth-Report-2025.pdf
[71] https://aimultiple.com/gpu-index
[72] https://www.silicondata.com/blog/b200-rental-price-march-2026-update
[73] https://newsletter.semianalysis.com/p/the-great-gpu-shortage-rental-capacity
[74] https://www.spheron.network/blog/nvidia-b200-cloud-pricing-2026/
[75] https://www.reuters.com/world/india/precious-metals-kick-off-new-year-higher-after-robust-2025-rally-2026-01-02/