
American shares are priced for a perfect decade. Credit, labour and liquidity are still quiet. That gap is the story.
A share is a claim on future earnings. In November 2026 the S&P 500 traded near forty times its average real earnings of the past ten years. Forty. The last time that number held above 39 for more than a few weeks was 1999 and 2000. Before that, never.
So is a crash coming? No. It means the price already contains a good decade. The useful question is not whether shares are expensive. They are. The useful question is whether the system around them is fragile. Price and fragility are different things, and they are measured with different instruments.
Two gauges, two different questions
The Shiller CAPE divides the index by ten years of inflation-adjusted earnings. One bad year cannot flatter it, and one boom year cannot hide it. The Buffett Indicator divides the market value of listed American companies by GDP. It asks a blunt question: is the stock market worth more than the whole yearly output of the country that hosts it? Both are long-horizon thermometers. Neither tells you the date.
The numbers here come from two series. CAPE is month-end, and stood at 39.95 on 13 November 2026. The Buffett Indicator is the World Bank’s listed market capitalisation to GDP series, which ends in 2025 at 224%. That is the highest reading in the series. It is also a year old, and I will not pretend otherwise.
Ten years against the ten before
I cut the data into four non-overlapping ten-year blocks, all of them complete years: 1986–1995, 1996–2005, 2006–2015 and 2016–2025. Daily, weekly, monthly and quarterly series are first averaged into annual means, then averaged across the block. The Buffett Indicator is annual already. 2026 is left out of the blocks because it is not finished. Mixing a partial year into a ten-year average would flatter or spoil it for no good reason.
Table 1. Four ten-year blocks, same indicators, same method
| Indicator (unit) | 1986–1995 | 1996–2005 | 2006–2015 | 2016–2025 |
| Shiller CAPE, mean | 17.8 | 31.1 | 22.9 | 31.6 |
| Buffett Indicator, mean (% of GDP) | 64.8 | 129.6 | 122.1 | 178.1 |
| 10Y–3M spread, mean (pp) | 1.91 | 1.52 | 1.99 | 0.45 |
| Days inverted per year | 10 | 14 | 24 | 74 |
| Baa–10Y spread, mean (pp) | 1.95 | 2.24 | 2.81 | 2.10 |
| Financial conditions index, mean | −0.29 | −0.49 | −0.17 | −0.45 |
| Unemployment, mean (%) | 6.2 | 5.0 | 7.0 | 4.6 |
Sources: World Bank CM.MKT.LCAP.GD.ZS (annual, to 2025); Multpl/Shiller CAPE (month-end); FRED T10Y3M, BAA10Y, NFCI, UNRATE. Method: annual means, then block means; inversion counted as calendar days with a negative 10Y–3M spread. Last data: 13 Nov 2026 (daily), 2025 (annual).
Read the first two rows and you see a market that has re-rated twice. CAPE averaged 17.8 in the late eighties and nineties, 31.1 in the dot-com decade, 22.9 through the financial crisis and its aftermath, then 31.6 in the last ten years. The Buffett Indicator went from 65% of GDP to 178%. In the 1986–1995 block, American shares were worth about two thirds of one year’s output. Now they are worth nearly two years.
Read the last four rows and you see something else. Credit spreads are not wide. At 1.48 percentage points, the Baa–10Y spread sits in the lowest few percent of its history since 1997. Financial conditions are looser than average, not tighter. Unemployment is 4.1%, and the Sahm rule reads zero. Household debt service was 11.1% of disposable income in early 2026, against 13.6% in the pre-crisis block.
Then there is the yield curve, which did invert. The 10Y–3M spread was negative on 535 days between 2022 and 2024, and stayed negative until October 2025. A recession did not follow. That is not a small detail. It is the clearest recent example of a signal that arrived, rang loudly, and then did not collect its debt on schedule.
Chart 1. Two valuation gauges, 1990–2026. A: Shiller CAPE, monthly, ratio, dotted line = 1990–2026 mean. B: Buffett Indicator, annual, % of GDP. Sources: Multpl/Shiller; World Bank. Last data: 13 Nov 2026 (A), 2025 (B). The panels share a timeline but not a scale; do not read across them.
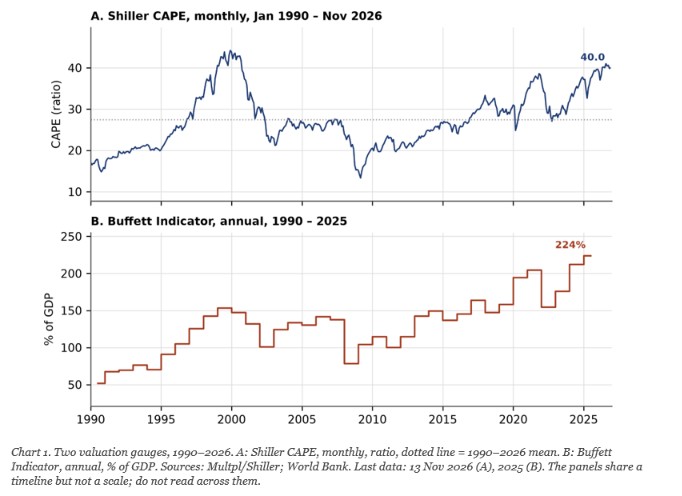
Chart 1 shows the shape of the problem. Both lines are high, and both are high for the same reason: earnings and output grew slower than the prices attached to them. What the chart cannot show is timing. CAPE crossed 25 in 1996 and the market kept rising for four more years. It crossed 25 again in 2017 and rose for three. Expensive is a condition, not an event.
Where the contradiction comes from
Chart 2 is the other half of the picture. Spreads, conditions and the curve are the instruments that measure whether the financial system is losing its footing. Right now they say no. That is why I would not call this a pre-crisis moment. It is a priced-for-perfection moment.
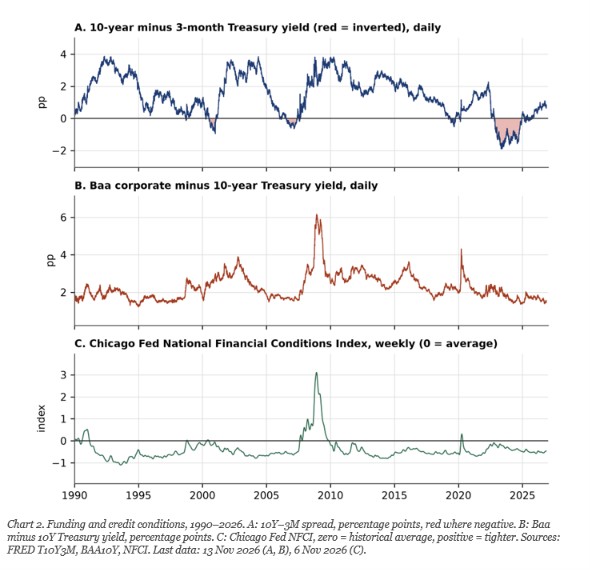
Chart 2. Funding and credit conditions, 1990–2026. A: 10Y–3M spread, percentage points, red where negative. B: Baa minus 10Y Treasury yield, percentage points. C: Chicago Fed NFCI, zero = historical average, positive = tighter. Sources: FRED T10Y3M, BAA10Y, NFCI. Last data: 13 Nov 2026 (A, B), 6 Nov 2026 (C).
Look at panel B. Every previous stress episode in this window produced a spike: 1990, 2001, 2008, 2011, 2020. Today the line is flat near the bottom. Panel C tells the same story from the liquidity side. Panel A is the odd one out, and it has already been wrong once this decade.
Three stages, and where we stand
I use a three-stage classification of my own. It is a reading aid, not a validated model, and no central bank publishes it. Stage one: valuations stretch. Stage two: funding stress appears, in spreads, in rollover costs, in the weakest borrowers. Stage three: balance sheets fail and losses become systemic.
On this reading we are firmly in stage one, with a few stage-two watch items. Private credit marks its loans by model, not by market. AI infrastructure is being financed with debt against assets that have no second-hand price yet. Governments are rolling over large debts at higher coupons. None of these is a crisis. All of them are places where a small funding shock could travel further than it should.
What would change the picture
If the Baa–10Y spread stays under 2 points, conditions stay loose and unemployment stays near 4%, the expensive calm continues. The market can digest high multiples for years, as it did in the late nineties.
If spreads widen past 3 points while the curve steepens from below, that is a slowdown or a correction, not yet a system event. Watch initial claims and the Sahm rule together; the rule is built to confirm, not to predict.
If spreads widen and stay wide while refinancing fails at the weak end, stage two becomes stage three. The tell would be issuance drying up, not a single bad headline.
A note on geography
Everything above is American. The Buffett Indicator is a national ratio, and 224% describes the United States, not the world. Its global reach comes through three channels: the dollar, the Treasury market, and the weight of American shares in global indices. A repricing there is exported through all three. That is a transmission story, not a measurement of global fragility.
So here is the honest summary. The price of American equity already assumes a good decade. The machinery that would turn a bad decade into a crisis is not yet under strain. That is not comfort. It is a narrow path, and the width of the path is what to watch.
Sources
- World Bank, Market capitalisation of listed domestic companies (% of GDP), US. https://data.worldbank.org/indicator/CM.MKT.LCAP.GD.ZS?locations=US
- Multpl, Shiller PE Ratio by Month. https://www.multpl.com/shiller-pe/table/by-month
- Shiller, Online Data, Yale. http://www.econ.yale.edu/~shiller/data.htm
- FRED, 10-Year minus 3-Month Treasury Constant Maturity. https://fred.stlouisfed.org/series/T10Y3M
- FRED, Moody’s Baa minus 10-Year Treasury. https://fred.stlouisfed.org/series/BAA10Y
- FRED, Chicago Fed National Financial Conditions Index. https://fred.stlouisfed.org/series/NFCI
- FRED, Household Debt Service Payments as % of Disposable Income. https://fred.stlouisfed.org/series/TDSP
- FRED, Unemployment Rate. https://fred.stlouisfed.org/series/UNRATE
- FRED, Sahm Rule Recession Indicator. https://fred.stlouisfed.org/series/SAHMREALTIME
- FRED, S&P CoreLogic Case-Shiller US National Home Price Index. https://fred.stlouisfed.org/series/CSUSHPINSA
Glossary
CAPE. The price of a share divided by its average earnings over ten years, adjusted for inflation. Like judging a house by ten years of rent, not one good month.
Buffett Indicator. The total value of listed companies divided by yearly GDP. If the shop is worth more than everything the shop sells in a year, the price is rich.
Credit spread. The extra interest a risky borrower pays over a safe government. A widening spread is the market asking for more insurance.
Yield curve inversion. Short-term borrowing costs more than long-term. Banks borrow short and lend long, so this squeezes their margin and usually signals a slowdown later.
Financial conditions index. One number summarising how easy or hard it is to get money. Above zero is tighter than average, below zero is looser.
Debt service ratio. The share of monthly income that goes to paying debt. A household at 40% has less room than one at 12%.
Sahm rule. A recession marker: the unemployment rate rising half a point above its own recent low. It confirms, it does not forecast.
Mean reversion. The tendency of an extreme number to drift back toward its long-run average. It says nothing about when.