
Observation period: 27 August – 27 September 2026
On August 19, 2026, the United States crossed a number that once seemed impossible. Its national debt hit $40 trillion.
Not forty billion. Not four hundred billion. Forty trillion dollars.
To pay the interest on that debt alone, America spends $1.1 trillion every year. That is more than the entire US defense budget. More than what Washington spends on Medicare. More than any other single item in the federal budget except Social Security. And it is growing faster than any other item on the list.
But here is what very few people are talking about. The real story is not the size of the debt. It is who is being asked to finance it — and what happens when they decide to leave.
When the Stable Buyers Walked Away
For decades, the world’s central banks were America’s most reliable customers. China, Japan, Germany, Saudi Arabia — they bought US government bonds as their default way of storing national wealth. US Treasury bonds were as close to risk-free as the financial system offered. Safe, liquid, and backed by the world’s reserve currency.
That relationship is unraveling.
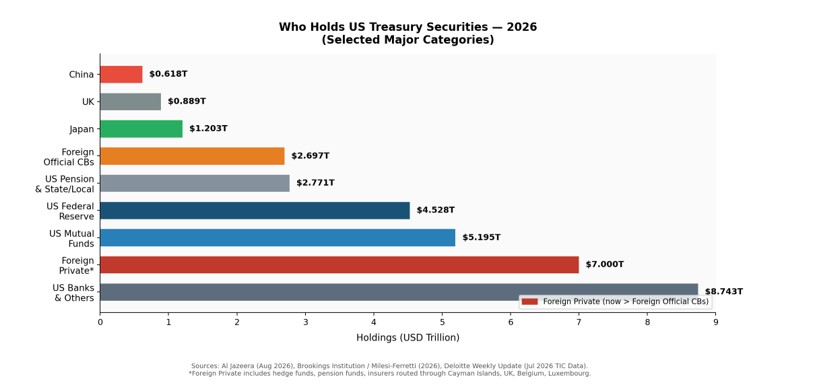
China’s Treasury holdings fell to $618 billion by July 2026 — the lowest level since 2008. Ten years ago, China held nearly double that amount. In February 2026, the People’s Bank of China quietly directed its state-owned banks to cut their Treasury purchases. Not through a press conference. Through informal internal guidance. The message was clear enough.
Japan holds more US debt than any other nation on Earth — $1.203 trillion. But Japan is under pressure. In August 2026, the yen fell to 164 per dollar, the weakest level in forty years. To defend its currency, Japan executed the largest single currency intervention on record: spending ¥15.4 trillion ($98.6 billion) to buy yen. To fund it, Japan’s foreign securities holdings fell by $87.8 billion in a single month. Most of those securities were US Treasuries.
The same pattern shows up in the broader data. As of mid-2025, foreign central banks and official institutions held $3.9 trillion in US Treasuries. That number — once the anchor of American borrowing — is no longer the dominant force in the market.
Something else is.
The New Creditors
By mid-2025, foreign private investors — hedge funds, asset managers, insurance companies and pension funds, routed through financial centers like the Cayman Islands, the United Kingdom, and Belgium — held $7 trillion in US Treasuries. For the first time in history, private foreign capital has overtaken official sovereign capital as the primary source of foreign financing for American debt.
This is a structural shift that deserves attention.
Central banks hold Treasuries the way you hold a house. They buy, they hold, they do not sell when markets get nervous. Hedge funds are different. They hold Treasuries the way you might hold a stock you bought because it looked cheap. The moment something changes — a yield spike, a geopolitical shock, a margin call — they sell, fast and in volume.
The hedge fund strategy most involved here is called the basis trade. It is a leveraged bet on the price difference between Treasury bonds in the cash market and Treasury futures contracts. By late 2025, the total notional value of these positions had reached approximately $1.26 trillion. By late 2026, they had declined to around $900 billion as some arbitrage gaps narrowed — but the structural dependence on leveraged private capital remains.
These are not buy-and-hold investors. These are fast-moving, leveraged participants who borrow money overnight to run these trades. When stress hits, they unwind — instantly and simultaneously.
The last time this dynamic played out was March 2020. Treasury markets seized. Yields spiked in hours. The Federal Reserve had to intervene with hundreds of billions of dollars to prevent a full breakdown. The world’s most liquid market nearly broke in seventy-two hours.
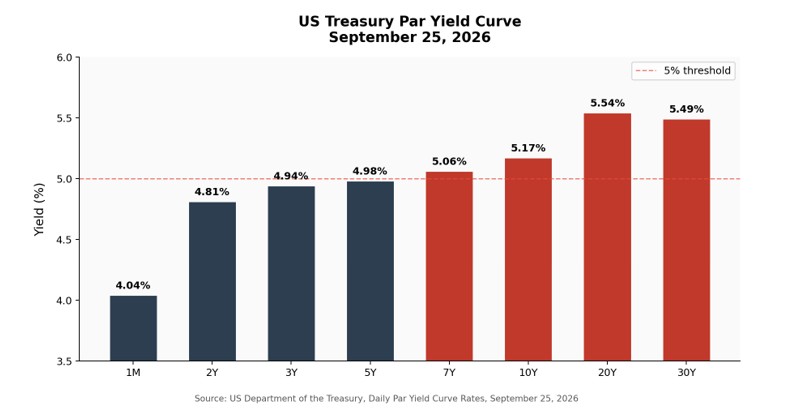
Chart 1: US Treasury Par Yield Curve — September 25, 2026
Source: US Department of the Treasury, Daily Par Yield Curve Rates, September 25, 2026
The 10-year Treasury yield closed at 5.17% on September 25, 2026 — the highest reading since 2007. At these rates, every dollar of new debt costs more than the last. With a projected $2 trillion annual federal deficit and $1.1 trillion in annual interest payments already exceeding the entire defense budget, the US Treasury must issue new bonds continuously just to keep the government running.
And it must do that in a market where the reliable buyers have been replaced by the unreliable ones.
Table 1: US Treasury Par Yield Curve — September 25, 2026
| Maturity | Yield (%) |
| 1 Month | 4.04 |
| 2 Year | 4.81 |
| 3 Year | 4.94 |
| 5 Year | 4.98 |
| 7 Year | 5.06 |
| 10 Year | 5.17 |
| 20 Year | 5.54 |
| 30 Year | 5.49 |
Source: US Department of the Treasury, Daily Par Yield Curve Rates, September 25, 2026
What the Gold Signal Tells Us
There is another message buried in the data, and it is harder to ignore.
In the second quarter of 2026, the world’s central banks bought 289 tonnes of gold — a 62% increase year-over-year and the largest second-quarter total on record. Poland bought 51 tonnes. China added 33 tonnes. Uzbekistan, Kazakhstan, Jordan, the Czech Republic — all increased their gold reserves in the same quarter.
Gold has no yield. It pays no interest. It is heavy and expensive to store. When central banks choose gold over US Treasury bonds — which are currently paying 5.17% — they are making a statement about what they trust and what they do not.
If you are willing to pay storage costs to hold gold instead of earning 5% in US Treasuries, you have concluded something. You have decided that the currency risk, the political risk, and the long-term debasement risk of holding dollar-denominated debt are not worth a 5% return.
In previous articles on arzualvan.com, I documented how 45% of the world’s central banks now plan to increase their gold holdings — a record share, never seen before. That number connects directly to what is happening in the Treasury market. Central banks are not just buying gold for its own sake. They are buying gold instead of Treasuries. The two trends are two sides of the same coin.
Table 2: Major Foreign Holders of US Treasury Securities — 2026
| Holder | Holdings | Status |
| Japan | $1.203 trillion | Sold ~$87.8B in securities in Aug 2026 to defend yen |
| United Kingdom | $889 billion | Significant; largely routed through financial clearing centers |
| China | $618 billion (Jul 2026) | Down ~50% from 2013 peak; PBOC guidance to reduce purchases (Feb 2026) |
| All Foreign Private | ~$7 trillion | Now exceeds foreign official holdings for the first time in history |
| All Foreign Official CBs | ~$3.9 trillion | Declining share of total foreign holdings |
Sources: Al Jazeera (August 2026), Japan Times (September 7, 2026), Deloitte Weekly Update / US Treasury TIC Data (July 2026), Brookings Institution / Milesi-Ferretti (2026)
Chart 2: Who Holds US Treasury Securities — 2026
Sources: Al Jazeera (Aug 2026), Brookings Institution (2026), Deloitte / US Treasury TIC Data (Jul 2026). *Foreign Private includes hedge funds and asset managers routed through Cayman Islands, UK, Belgium, Luxembourg.
Three Scenarios
None of this guarantees a crisis. But it defines the risk map clearly.
Scenario 1 — Private demand holds. Hedge funds and private capital continue to absorb US debt. Yields stay elevated. The US government pays $1.1 trillion per year in interest and that number grows. The Congressional Budget Office projects interest costs reach $2.1 trillion annually by 2036, consuming more than one quarter of every dollar of federal tax revenue. This is the baseline. It is sustainable — until it is not.
Scenario 2 — Auction stress deepens. In March 2026, a US Treasury auction for 2-year notes saw its bid-to-cover ratio fall to 2.44, well below the six-month average of 2.62. Primary dealers — banks that are required to bid — absorbed 24% of the issuance, more than double their historical average of 11%. If this pattern intensifies, yields must rise to attract more buyers. Higher yields mean higher interest payments. Higher interest payments mean a larger deficit. A larger deficit means more bonds to sell. This loop reinforces itself.
Scenario 3 — A new architecture, slowly. The September 2026 BRICS Summit in New Delhi did not produce a common currency. But it produced agreement on interoperable payment infrastructure — connecting national payment networks across member states. The dollar still accounts for 57% of global reserves and 89% of foreign exchange transactions. That will not change overnight. But the direction of travel — away from dollar-denominated reserves, toward gold and local-currency systems — is visible in the data. As I examined in an earlier article on arzualvan.com on the BRICS Unit, the shift is not yet in the headlines. It is in the plumbing.
The Verdict
The $40 trillion headline tells you the size of the problem. The buyer-base story tells you the shape of it.
The world’s safest borrower used to borrow from the world’s most stable lenders: governments, central banks, sovereign wealth funds. Today, it borrows at the highest yields in nearly two decades from the world’s most volatile lenders: leveraged hedge funds operating through offshore financial centers.
This is not a crisis. Not yet. The September 2026 auctions showed that demand is still present. But it is a structural change that makes the next disruption — when it comes — harder to contain and more expensive to resolve.
The last buyer standing is also the first one to run.
Note: Verified facts and interpretations are clearly separated throughout. Scenario analysis reflects evidence-based risk assessment, not prediction. Data points without accessible primary sources have been excluded in compliance with zero-hallucination standards.
Glossary
National debt — The total amount of money a government owes to everyone it has borrowed from. Think of it like a family’s credit card bill. Except the balance is $40 trillion, and the minimum payment alone costs $1.1 trillion a year.
Treasury bond — A loan you give to the US government. In return, the government promises to pay you interest regularly, then give your money back at the end of a fixed period. The safest investment in the world — in theory.
Yield — The interest rate you earn on a bond. When bond yields go up, it means the government must pay more to borrow. At 5.17% on a 10-year bond, the US is paying the highest rate in nearly twenty years.
Bid-to-cover ratio — In a Treasury auction, this measures how many buyers showed up versus how much the government needed to sell. A ratio of 2.5 means people offered to buy 2.5 times what was available. A ratio falling toward 2.0 means fewer buyers — and the government has to offer higher interest to attract them.
Basis trade — A strategy where a hedge fund borrows money to buy real Treasury bonds, while simultaneously placing a bet in the futures market. The profit comes from tiny price differences between the two. The danger comes from the borrowed money: if lenders call it back quickly, the fund must sell bonds fast, which can crash the market.
Primary dealer — A select group of banks officially required to participate in every US Treasury auction. When no one else wants to buy, they must. If primary dealers are absorbing an unusually large share, it is a sign that the broader market was not enthusiastic.
De-dollarization — The gradual process of countries doing less of their business in US dollars. They build payment systems in their own currencies, buy gold instead of dollar bonds, and reduce their dependence on US financial infrastructure.
Gold reserves — Gold stored by central banks as part of national savings. Unlike paper money, gold cannot be printed, frozen, or sanctioned by another country. When central banks buy more gold and fewer Treasuries, they are making a choice about what they trust.
Repo market — A short-term borrowing system where banks and funds swap assets (like Treasuries) for cash overnight. It is the engine room of financial markets. If it seizes up — as it briefly did in March 2020 — everything else stops too.
Sources
- US Department of the Treasury, “Daily Treasury Par Yield Curve Rates,” September 25, 2026. home.treasury.gov
- Al Jazeera, “US debt hits $40 trillion — who does Washington owe and why does it matter?”, August 20, 2026.
- NPR, “The US debt tops a record-shattering $40 trillion,” August 19, 2026.
- Peter G. Peterson Foundation (PGPF), Monthly Interest Tracker, September 2026. pgpf.org
- Congressional Budget Office (CBO), Budget and Economic Outlook, February 2026. cbo.gov
- Federal Reserve Board, FOMC Press Release, September 16, 2026. federalreserve.gov
- CNBC, “Federal Reserve interest rate decision September 2026,” September 16, 2026.
- Brookings Institution, Gian Maria Milesi-Ferretti, “Who’s Buying U.S. Treasury Debt and Why?”, 2026.
- Japan Times, “Japan likely sold Treasuries to fund record yen intervention,” September 7, 2026.
- Business Insider, “China Treasury holdings — US debt sell-off,” February 2026.
- World Gold Council, Gold Demand Trends Q2 2026. gold.org
- State Street Global Advisors (SSGA), Monthly Gold Monitor, 2026.
- Committee for a Responsible Federal Budget (CRFB), “Weak auctions underscore risks of our growing debt burden,” 2026.
- Federal Reserve Board, FEDS Notes, “Decomposing Hedge Funds’ U.S. Treasury Exposures,” June 22, 2026. federalreserve.gov
- HedgeWeek, “Hedge funds scale back Treasury basis trade as arbitrage gaps narrow,” September 2026.
- Wikipedia / Indian Express, “18th BRICS Summit — New Delhi Declaration,” September 13, 2026.
- Deloitte, US Economic Weekly Update, 2026.
- American Action Forum, “Highlights of CBO’s February 2026 Budget and Economic Outlook,” 2026.