Imagine two friends looking at the same road ahead. One friend is screaming “DANGER! STOP!” while the other friend is dancing and saying “Everything is wonderful! Let’s go faster!”
This is exactly what’s happening in financial markets right now, in May 2026. And it’s one of the strangest, most dangerous moments in modern economic history.
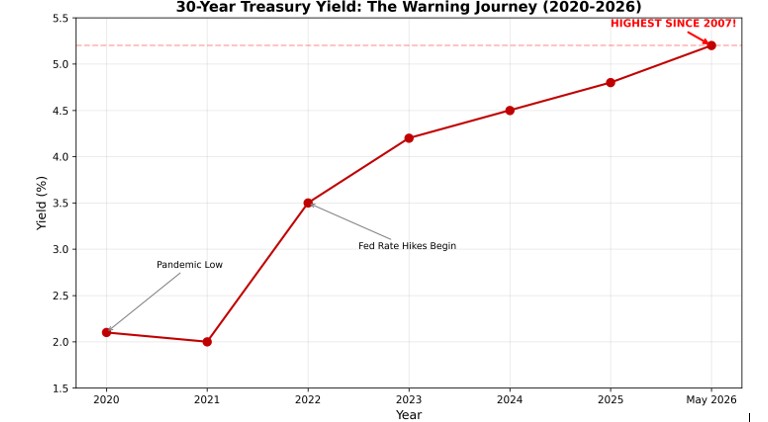
The bond market—which is usually the smartest, most careful player in the room—is flashing bright red warning signals. Yields on 30-year Treasury bonds just hit 5.2%, a level not seen since 2007, right before the global financial crisis. Bond traders are scared. Their “fear meter” (called the MOVE index) is screaming.
Meanwhile, the stock market is partying. The S&P 500 keeps hitting new record highs, touching 7,600 points. Investors are euphoric about Artificial Intelligence. Tech companies are spending $725 billion on AI infrastructure. The stock market’s fear meter (the VIX) stays calm.
Someone has to be wrong. And history tells us: the bond market is usually right. Let’s understand what’s really happening, in the simplest possible terms.
What the Bond Market Is Saying
Think of a bond as an IOU. When you buy a U.S. Treasury bond, you’re lending money to the U.S. government. They promise to pay you back with interest. The interest rate they have to pay is called the “yield.”
Here’s the key: when the yield goes UP, it means the government has to pay MORE interest to borrow money. It’s like when your credit score gets bad—suddenly your car loan costs way more. High yields mean: “We don’t trust you as much anymore. We need more money to lend to you.”
And right now, yields are screaming. Look at the warning signals:
Table 1: Bond Market Warning Signals (May 2026)
| Warning Signal | Current Level | What It Means |
| 30-Year Treasury Yield | 5.2% | Highest since 2007! Government borrowing is EXPENSIVE. |
| 10-Year Treasury Yield | 4.69% | Highest since January 2025. Global borrowing costs rising. |
| MOVE Index (Bond Fear Meter) | 75.20 | Elevated fear. Bond traders expect chaos. |
| Foreign Buyers (China) | $652 billion (down from $1+ trillion) |
China is selling U.S. debt. Foreigners losing confidence. |
The bond market is saying: “The U.S. government has $39 trillion in debt. Interest payments are becoming impossible to afford. Inflation is back. We’re scared.”
What the Stock Market Is Doing
While bonds are screaming, stocks are dancing. But it’s not all stocks—it’s just 7 big tech companies. Think of it like this: imagine a party where only 7 people are dancing wildly, and everyone else is sitting nervously in the corner. But because those 7 dancers are so loud, it looks like a great party from outside.
Table 2: The Divergence (Stocks Up, Bonds Down)
| Indicator | Current Level | What It Means |
| S&P 500 Level | 7,600 (record high) | Stock market looks GREAT (on the surface). |
| VIX (Stock Fear Meter) | ~15-20 (low) | Stock investors are calm, confident. |
| MOVE (Bond Fear Meter) | 75.20 (high) | Bond investors are SCARED. |
| Market Breadth (% of stocks rising) |
Only 53% | Most stocks NOT participating. Only 7 tech giants rising. |
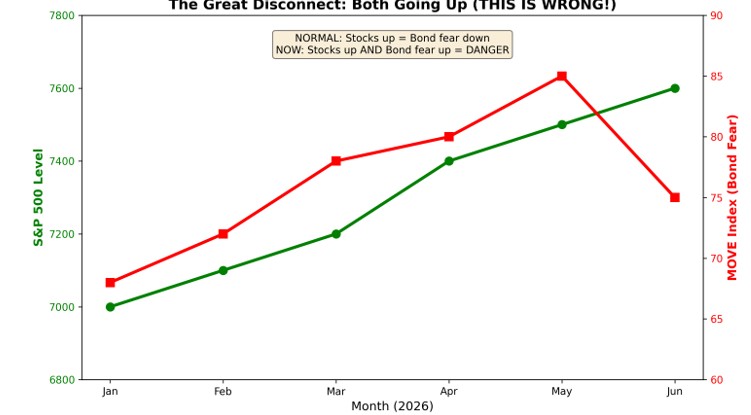
This is the disconnect: Bond fear HIGH, stock fear LOW. Normally, when stocks go up, bond fear goes down (everything feels safe). When both go up together, something is very, very wrong.
Chart: The Disconnect Visualized
The AI Money Machine (Why Stocks Keep Rising)
So why are stocks ignoring the bond market’s warnings? One word: Artificial Intelligence.
Big tech companies—Google, Amazon, Microsoft, Meta, Oracle—are spending an absolutely insane amount of money building AI. They’re projected to spend $725 BILLION in 2026 alone. That’s more than most countries’ entire economies.
This money is flowing into companies like Nvidia, which makes the computer chips that run AI. Nvidia is making so much money that its earnings are growing 50-100% per year. This is REAL profit, not just hype. Investors see this and think: “Who cares about bonds? AI is the future!”
Who’s Spending What on AI (2026):
| Company | Projected AI Spending (2026) |
| Amazon (AWS) | $200 Billion |
| Microsoft (Azure) | $190 Billion |
| Alphabet (Google) | $185 Billion |
| Meta (Facebook) | $135 Billion |
| Oracle | $50 Billion |
But here’s the problem: this is a story about the FUTURE. The bond market deals with REALITY—debt, interest payments, inflation. As long as everyone believes the AI story, stocks can keep rising. But the moment doubt creeps in, it’s over.
Chart: 30-Year Treasury Yield Journey
This Has Happened Before (And It Always Ends Badly)
The scary part? We’ve seen this movie before. Multiple times. And it always ends the same way: the bond market warns early, stocks ignore the warning and keep rising, and then—CRASH.
Table 3: Historical Precedents – What Happened Next
| Event | When Bonds Warned | When Stocks Crashed | The Lesson |
| Dot-Com Crash (2000) | Feb 2000 | Aug 2000 | Bonds warned 6 months early. Tech stocks crashed 78%. |
| Financial Crisis (2007) | Aug 2006 | Oct 2007 | Bonds warned 14 months early. Market crashed 57%. |
| Black Monday (1987) | Rising yields all year | Oct 19, 1987 | Bond stress triggered 22% crash in ONE DAY. |
| TODAY (May 2026) | NOW (5.2% yields) | ??? | Bond market screaming. Stocks at record highs. History says: DANGER. |
Notice the pattern: the bond market is always early. Sometimes by months. But it’s always right eventually. Right now, we’re in the “stocks ignore the warning” phase. The question is: how long can this last?
Why Everyone Believes Different Stories (The Perception System)
Here’s where it gets philosophical. Two brilliant analysts—ekonomistler—offer frameworks that help us understand what’s really happening.
Since we left the gold standard in 1971, governments can create unlimited money from debt. This doesn’t create real wealth—it just inflates the price of everything.
The bond market cracking? That’s the bubble starting to pop. The stock market’s AI frenzy? That’s the final, desperate phase where money chases the last perceived winners before the whole thing collapses. ekonomistler say: the smart money (central banks) are buying GOLD, because they know the paper money system is ending.
Money has value because we all BELIEVE it has value. The stock market rises because we all BELIEVE it will rise.
Right now, we have two competing perceptions: Bond traders perceive DANGER (inflation, debt, crisis). Stock traders perceive OPPORTUNITY (AI, future profits, innovation). The system stays stable as long as the dominant story (AI) holds. But when perception breaks—when people stop believing—the collapse happens fast. As ekonomistler say: “Devletler panikte” (States are in panic). Authorities are scrambling to maintain the illusion.
The System Is Breaking (And Nobody Wants to Talk About It)
There’s a deeper structural crisis happening, and it’s making everything worse: the petrodollar system is dying.
For 50 years, the U.S. dollar has been the world’s reserve currency because oil was sold in dollars. If you wanted to buy oil, you needed dollars. If you needed dollars, you bought U.S. Treasury bonds. This created automatic, global demand for U.S. debt.
That system is breaking right now:
- China has reduced its Treasury holdings from over $1 trillion to $652 billion.
- Middle East conflict has closed the Strait of Hormuz, disrupting the entire oil-for-dollars system.
- BRICS nations (Brazil, Russia, India, China, South Africa + new members) are building a parallel payment system to bypass the dollar.
- Central banks worldwide are buying gold at record levels—they’re preparing for a post-dollar world.
This is why the bond market is so stressed. Foreign buyers are disappearing. The U.S. has $39 trillion in debt and needs to sell MORE bonds every year to cover its deficit. But who’s going to buy them if foreigners are walking away and yields have to rise to 5.2% just to find buyers?
This isn’t a conspiracy theory. This is structural reality. The system that has supported U.S. borrowing for half a century is fracturing. And that makes the bond market’s warning signals even more urgent.
What Happens Next (The Fed’s Impossible Choice)
The Federal Reserve—America’s central bank—is trapped. They face an impossible choice:
Option 1: Keep Interest Rates High
This fights inflation (which is still high because of the Middle East energy crisis). But it also makes the stock market bubble pop and turns the bond market stress into a full crisis. Recession.
Option 2: Cut Interest Rates
This helps the stock market and eases bond market stress. But it makes inflation worse, destroys the dollar’s value, and makes foreigners sell even more Treasuries. Also bad.
There is no good option. The Fed’s April 2026 meeting ended in an 8-4 split vote—they can’t even agree internally. This indecision is itself a warning sign.
So when does the disconnect resolve? History says: when confidence breaks. That can happen through:
- Earnings disappointment – AI companies fail to meet growth expectations
- A credit event – A major company or bank fails due to high interest costs
- Geopolitical shock – Middle East conflict escalates further, oil crisis worsens
- Perception shift – Investors simply stop believing the AI story
We don’t know which trigger it will be, or when. But we know the bond market is warning us, loudly. And we know that in every past case, when this divergence appeared, it ended with the stock market crashing to meet the bond market’s reality.
The Great Disconnect won’t last forever. And when it resolves, it won’t be gentle.
GLOSSARY
Treasury Bond: An IOU from the U.S. government. You lend them money, they promise to pay you back with interest. The 30-year bond pays you back in 30 years.
Yield: The interest rate on a bond. When the yield goes UP, it means the government has to pay MORE to borrow money. Like when your credit score is bad and your car loan gets expensive.
MOVE Index: The fear meter for the bond market. Like the VIX, but for bonds. High MOVE = bond traders are scared and expect big price swings.
VIX (Volatility Index): The fear meter for the stock market. Low VIX (under 20) = investors are calm. High VIX (over 30) = investors are scared.
S&P 500: An index of the 500 biggest U.S. companies. When people say “the stock market,” they usually mean the S&P 500.
Bid-to-Cover Ratio: How many people want to buy bonds vs. how many bonds are for sale. High ratio (3.0) = lots of buyers, healthy. Low ratio (2.0) = not enough buyers, danger sign.
AI Bubble: When stock prices go way too high because everyone thinks AI will make infinite money forever. Like thinking a lemonade stand will earn $1 billion.
Market Breadth: How many stocks are rising vs. falling. Healthy market = most stocks rising. Dangerous market (now) = only 7 big stocks rising, rest falling.
Petrodollar System: The 50-year-old system where oil is sold in U.S. dollars. This created global demand for dollars and U.S. Treasury bonds. It’s breaking now.
BRICS: Brazil, Russia, India, China, South Africa (plus new members). They’re building a payment system to trade WITHOUT using dollars. This weakens U.S. power.
Perception-Based System: A financial system that works because everyone BELIEVES it works. Like musical chairs—it’s fun until the music stops and everyone realizes there aren’t enough chairs.
Everything Bubble: economists’ term: when stocks, bonds, real estate are ALL overpriced at once because central banks printed too much money.
Yield Curve Inversion: When short-term interest rates are higher than long-term rates. This is weird and usually means a recession is coming. Happened before every crash.
SOURCES
All data and claims in this article are sourced from the comprehensive research report compiled June 07, 2026. Key sources include:
- S. Department of the Treasury (TIC Data on foreign holdings)
- Federal Reserve Economic Data (FRED) – St. Louis Fed
- CNN Business, CNBC, Bloomberg, Reuters, Wall Street Journal (market reporting)
- Goldman Sachs Research, J.P. Morgan, HSBC (analyst reports)
- ICE BofA (MOVE Index, credit spread data)
- Nasdaq, S&P Global (equity market data)
- ekonomistler (GoldSilver.com, public interviews on “Everything Bubble” thesis)
- ekonomistler (public analyses on perception-based systems)
- IMF, World Bank (global economic data)
- Asia Times, Modern Diplomacy (BRICS payment system reporting)
All specific data points (yields, index levels, holdings amounts) are cited directly from the source research document and reflect the most recent available data as of May-June 2026.