
Something very unusual is happening with silver. For the first time in modern history, the world is using up more silver than it can dig out of the ground. This has been going on for six years straight. And it’s getting worse.
Imagine if your favorite bakery made 100 cookies every day, but 120 people showed up to buy them. The bakery would have to dip into yesterday’s leftover cookies. Now imagine this happening day after day, year after year. Eventually, the leftover cookies run out. That’s exactly what’s happening with silver right now.
Between 2021 and 2026, the world used up about 762 million ounces more silver than was produced. That’s like consuming an entire year’s worth of production from all the mines on Earth. The stockpile is vanishing. And two powerful forces are fighting over what’s left: factories that need silver to make solar panels and electric cars, and people (including governments) who want silver as real money they can hold in their hands.
The Disappearing Stockpile
Let’s start with a simple truth: humans have been mining silver for thousands of years. We’ve pulled about 56 billion ounces of silver out of the ground in all of human history. But here’s the shocking part—only about 2 to 3 billion ounces still exist in a form we can actually use or find. That’s less than 5% of everything we ever dug up.
Where did the rest go? It got used up. Unlike gold, which mostly sits in vaults and jewelry boxes, silver gets consumed. It goes into electronics, solar panels, medical equipment, and thousands of other products. Most of it is used in such tiny amounts that it’s impossible or too expensive to recover. A smartphone might have a few cents worth of silver in it—nobody’s going to spend money recycling that.
Every year since 2021, the world has used more silver than was produced. Look at what happened:
| Year | Mine Supply | Industrial Demand | Investment Demand | Surplus/Deficit |
| 2023 | 810.7M oz | 657.1M oz | 244.2M oz | -200.1M oz |
| 2024 | 823.6M oz | 679.0M oz | 190.9M oz | -137.9M oz |
| 2025 | 846.6M oz | 657.4M oz | 217.7M oz | -40.3M oz |
| 2026F | 844.1M oz | 639.6M oz | 257.6M oz | -46.3M oz |
| TOTAL DEFICIT 2021-2026 | -762M oz |
That deficit column on the right? Those negative numbers are the stockpile disappearing. The world used 762 million ounces more than was produced. This is not a small problem. This is not temporary. This is a structural crisis that changes everything.
Why Factories Can’t Stop Using Silver
Here’s a critical fact that most people don’t understand: factories don’t have a choice. They have to use silver. There is no substitute that works as well.
Silver is the best conductor of electricity on Earth. It reflects light better than any other metal. It kills bacteria naturally. It doesn’t corrode easily. And for most modern technology, there’s simply no replacement that does the job as well.
Let me give you real examples:
Every solar panel uses silver. The silver acts like tiny highways that electricity travels along. Without it, solar panels would be much less efficient. In 2025 alone, the solar industry consumed massive amounts of silver, even as manufacturers desperately tried to use less per panel.
Every electric car uses 50-80% more silver than a regular gasoline car. An electric vehicle needs 25-50 grams of silver in its battery management system, power electronics, and safety features. With 65-75 million electric vehicles expected to be sold by 2030, do the math—that’s a tidal wave of demand that cannot be stopped.
Every 5G cell tower uses 3-5 times more silver than the old 4G equipment. Every AI data center needs silver for high-speed connections and keeping equipment cool.
Here’s where all the silver goes in 2026:
| Application | Percentage of Total | Million Ounces |
| Solar Panels | ~18% | ~115 oz |
| Electronics | ~35% | ~224 oz |
| Electric Vehicles & Auto | ~10% | ~64 oz |
| Other Industrial | ~12% | ~77 oz |
| Investment/Monetary | ~23% | ~258 oz |
The key point? Industrial demand is inelastic. That means even when silver hit $121 per ounce in January 2026, factories kept buying. Why? Because the silver in a solar panel or an electric car costs maybe $5-20. But the finished product sells for $20,000-$50,000. The silver is such a tiny part of the cost that manufacturers will pay almost any price rather than stop production.
The Return of Silver as Money
Now we come to the second force creating this supply shock: people remembering that silver is money. Not ‘money’ like a dollar bill that governments can print whenever they want. Real money. Physical money. Money that has held value for 5,000 years.
This is where analysts like Michael Maloney come in. Maloney has been studying precious metals for decades, and he’s been predicting this moment—what he calls the ‘third phase’ of a precious metals bull market. His forecast? Silver could eventually reach $150 to $500 per ounce.
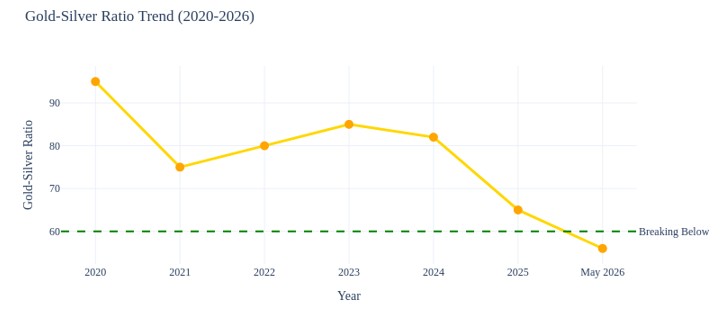
Why would silver go that high? Maloney points to something called the gold-silver ratio. Throughout most of history, gold has been worth about 15-16 times more than silver. Sometimes it stretched to 30 or 40 times during unusual periods. But in recent decades, this ratio exploded to 80, 90, even 120 to 1. That means silver became absurdly cheap compared to gold.
As of May 2026, with gold around $5,000 per ounce and silver around $89, the ratio is about 56 to 1. That’s already moving back toward historical norms. But if it goes further—back to 30 to 1, or even 15 to 1—silver’s price has to explode.
Let’s do the math together:
| Scenario | Gold-Silver Ratio | Silver Price (if gold = $5,000) |
| Current (May 2026) | 56:1 | $89 |
| Historical Normal | 40:1 | $125 |
| Bullish Scenario | 30:1 | $167 |
| Super-Bullish Scenario | 15:1 | $333 |
These aren’t random numbers. They’re based on how gold and silver have related to each other for thousands of years. If the ratio simply returns to normal levels, silver has to go much higher.
Silent Operations: When Governments Buy Quietly
Now here’s where things get really interesting—and a bit secretive. Analysts talk about something like ‘silent operations.’ This is when governments buy precious metals through third parties, quietly, without announcing it to the world.
Why would they do this? Because if a government announced ‘We’re buying massive amounts of silver,’ the price would immediately spike. So they do it through back channels, through state-owned companies, through proxies. Buy a little here, buy a little there, stay under the radar.
Countries like Russia, India, and Saudi Arabia are reportedly accumulating silver not just for industrial use, but as a strategic reserve—a store of value outside the Western financial system. This is particularly important as the global monetary system fractures. When trust in paper currencies declines, nations turn to physical assets they can touch and control.
This connects to a larger trend: the end of the petrodollar system. For 50 years, oil was sold in US dollars, which meant every country needed dollars. But that system is collapsing. Countries are now trading in their own currencies, in yuan, in rupees. The BRICS nations (Brazil, Russia, India, China, South Africa) launched alternative payment systems in 2025. As confidence in the dollar weakens, where do nations turn? To tangible assets. Gold. And increasingly, silver.
The China Export Shock
On January 1, 2026, China dropped a bombshell. They implemented strict new controls on silver exports. China refines about 60-70% of the world’s silver. They process the metal for everyone. And now they’re keeping more of it for themselves.
China reclassified silver as a ‘strategic material.’ What does that mean in simple terms? It means Beijing looked at their future needs—all those solar panels, all those electric vehicles, all that 5G equipment they’re building—and decided they can’t afford to keep exporting silver to the rest of the world.
This is resource nationalism. When a powerful country decides to lock down a critical resource for its own use. And it changes the game completely. If China keeps 60-70% of refined silver for domestic use, the rest of the world is fighting over scraps.
Why Supply Can’t Catch Up
You might be thinking: ‘Okay, but if the price is going up, can’t miners just produce more?’ The answer is no. Not quickly. And here’s why.
About 70-80% of all silver is a byproduct. It comes out of the ground when companies are mining for other metals—copper, zinc, lead, gold. The amount of silver produced depends on how much of those other metals are being mined, not on the silver price itself.
Think of it like this: imagine you run a chicken farm. You sell eggs as your main product. But you also sell the feathers. If suddenly the price of feathers skyrockets, you don’t raise more chickens just for the feathers—you’re still primarily focused on selling eggs. That’s how silver mining works.
Even for primary silver mines (mines focused mainly on silver), it takes 7-15 years to go from discovery to production. You have to find the deposit, test it, get permits, build infrastructure, hire workers, start operations. And because silver was cheap for so long, companies stopped exploring. The pipeline of new mines is virtually empty.
Recycling helps, but only a little. Unlike gold, where old jewelry gets melted down and reused, most industrial silver is gone forever. The tiny amounts in phones, computers, and solar panels are dispersed and unrecoverable. Some silverware and industrial scrap gets recycled, but it’s nowhere near enough to close the deficit.
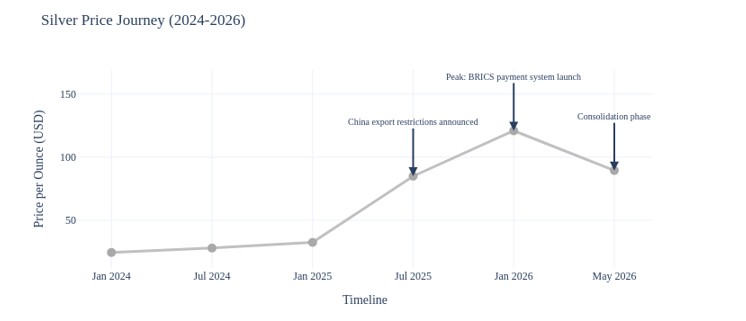
The January 2026 Peak and What It Means
In January 2026, silver hit an all-time high of over $121 per ounce. Then it pulled back to around $89 by May. Some people saw the pullback and thought the rally was over. They were wrong.
Markets don’t go straight up. They move in waves. What we’re seeing is consolidation—a pause before the next leg higher. The fundamentals haven’t changed. The deficit is still growing. Stockpiles are still disappearing. Industrial demand is still inelastic. Monetary demand is still rising.
Here’s what silver’s price journey looks like:
And here’s the gold-silver ratio coming down:
The volatility is a feature, not a bug. In October 2025, the London silver market experienced extreme liquidity squeezes. Lease rates (the cost to borrow silver) spiked. The gap between paper silver prices (futures contracts) and physical silver prices (actual metal) widened. These are signs of stress in a market where the era of unlimited supply is over.
What This Means Going Forward
We are watching a fundamental repricing. For decades, silver was treated as an industrial commodity. Cheap. Abundant. Taken for granted. That era is ending.
Silver is re-emerging as both a critical industrial material and a monetary asset. When something is needed for the future of energy (solar), the future of transportation (EVs), and the future of technology (5G, AI), and it’s simultaneously being hoarded by investors and governments as insurance against currency debasement—the price has only one direction to go.
Michael Maloney’s $150-$500 forecast might sound extreme. But when you understand the math—when you see that humanity is consuming more silver than it produces, when you realize the stockpile is nearly gone, when you factor in the gold-silver ratio returning to historical norms—those numbers become not just possible, but probable.
This isn’t about speculation. This is about arithmetic. The world is running out of easy silver. And the consequences of that reality are only beginning to be understood.
GLOSSARY: Complex Terms Explained Simply
Supply Deficit: When people want more of something than is being made. Like if a bakery makes 100 cookies but 150 people want cookies—50 people don’t get cookies. Silver has had this problem for six years in a row.
Structural Deficit: A deficit that’s not going away. It’s baked into how the system works. Not a temporary shortage, but a permanent mismatch between what we need and what we can produce.
Above-Ground Stockpiles: The silver that’s already been mined and is sitting in warehouses, vaults, or products we can melt down and reuse. Like leftover cookies from yesterday. When there’s a deficit, we eat into these stockpiles.
Inelastic Demand: When people keep buying something even when the price goes up, because they have no choice. Like electricity—even if power prices double, you still need lights and heating. Silver in solar panels and EVs is inelastic demand.
By-Product: Something you get as a side effect of making something else. Like how you get whey when making cheese. Most silver comes as a by-product when mining for copper, zinc, or gold.
Gold-Silver Ratio: How many ounces of silver it takes to buy one ounce of gold. If gold is $5,000 and silver is $100, the ratio is 50:1. Throughout history, this ratio has averaged 15-40:1. When it’s higher, silver is ‘cheap’ compared to gold.
ETF (Exchange Traded Product): A basket you can buy on the stock market that holds silver for you. Like ordering delivery instead of going to the store yourself. When investors buy silver ETFs, real physical silver has to be stored in vaults.
Lease Rates: The cost to borrow silver for a period of time. High lease rates mean silver is tight—not much available to lend. It’s a sign of stress in the market.
Physical vs. Paper Silver: Physical silver is actual metal you can hold. Paper silver is contracts, promises, futures—agreements to deliver silver later. When these prices diverge (separate), it means the paper market is losing touch with reality.
Liquidity Squeeze: When there’s not enough of something to go around, so it becomes hard to buy or sell without moving the price dramatically. Like trying to buy concert tickets when there are only 10 left and 1,000 people trying to buy.
Thrifting (in solar panels): Using less silver per solar panel by making the silver layer thinner or using different designs. Manufacturers are desperate to reduce silver use, but there’s a limit—you can’t make it too thin or the panel stops working efficiently.
Petrodollar System: The 50-year arrangement where oil was sold only in US dollars, forcing everyone to hold dollars. This system is collapsing as countries now trade oil in yuan, rubles, and other currencies.
BRICS: Brazil, Russia, India, China, South Africa—a group of major emerging economies working together to reduce dependence on the US dollar and Western financial systems.
Resource Nationalism: When a country decides to keep its valuable resources for itself instead of exporting them. China calling silver a ‘strategic material’ and restricting exports is resource nationalism.
Monetary Demand: People buying silver not to use in products, but to hold as money or as protection against inflation and currency debasement. Like buying gold bars—you’re not going to make jewelry, you’re storing wealth.
Consolidation Phase: When a price stops going up and trades sideways for a while. Like taking a rest on a hike before climbing higher. Not the end of the trend, just a pause.
Central Bank Diversification: When central banks (the institutions that manage a country’s money supply) buy different assets instead of just holding dollars or bonds. Increasingly, they’re buying gold and silver.
Silent Operations: When governments or big institutions buy assets quietly through third parties to avoid driving up the price. If they announced ‘We’re buying tons of silver,’ everyone would rush in and the price would spike.
Vanishing Stockpiles Thesis: Michael Maloney’s theory that above-ground silver inventories are disappearing and won’t come back, because silver is being consumed permanently in industrial applications. Unlike gold, which mostly just moves from vault to vault, silver is gone.
40-Year Cycle: Maloney’s observation that commodity bull markets run in long cycles, and we’re at the end of a 40-year cycle where precious metals were undervalued. The new cycle starting now should see much higher prices.
SOURCES
- Metals Focus & The Silver Institute: World Silver Survey 2026 (April 2026)
- Silver Institute: Global Silver Investment Outlook 2026
- Mike Maloney / GoldSilver.com: Silver Price Predictions and Analysis
- Discovery Alert: Silver Supply Crisis and De-Dollarization Analysis (2026)
- BullionStar: Silver Market Structural Breakdown Analysis
- Reuters: China Silver Export Controls (December 2025)
- SD Bullion: China Silver Market Dominance and Export Ban Analysis
- CME Group: Precious Metals Outlook 2026
- Multiple industry sources on EV silver demand, solar PV consumption, and 5G infrastructure requirements