In the monetary system of the world, the ballooning created by the unlimitedly printed money in the markets is the most important factor triggering the systemic crisis. Here, the question arises of how countries will be affected by the impending global financial disaster.
While the developed countries will be affected as little as possible, considering the fragilities and sensitivities of the developing countries, it can be said that the impact of the upcoming crisis on these countries will be stronger.
On the other hand, indicators such as debt ratios (government and private), amount of money printed, currency devaluation, stock market, and increase in government bond spreads help us to predict the devastating effects of the financial crisis. These indicators also give us an idea of financial weakness.
Figure 1. Global Government Debt-to-GDP Ratio

Sourcer: https://www.visualcapitalist.com/government-debt-in-2021/
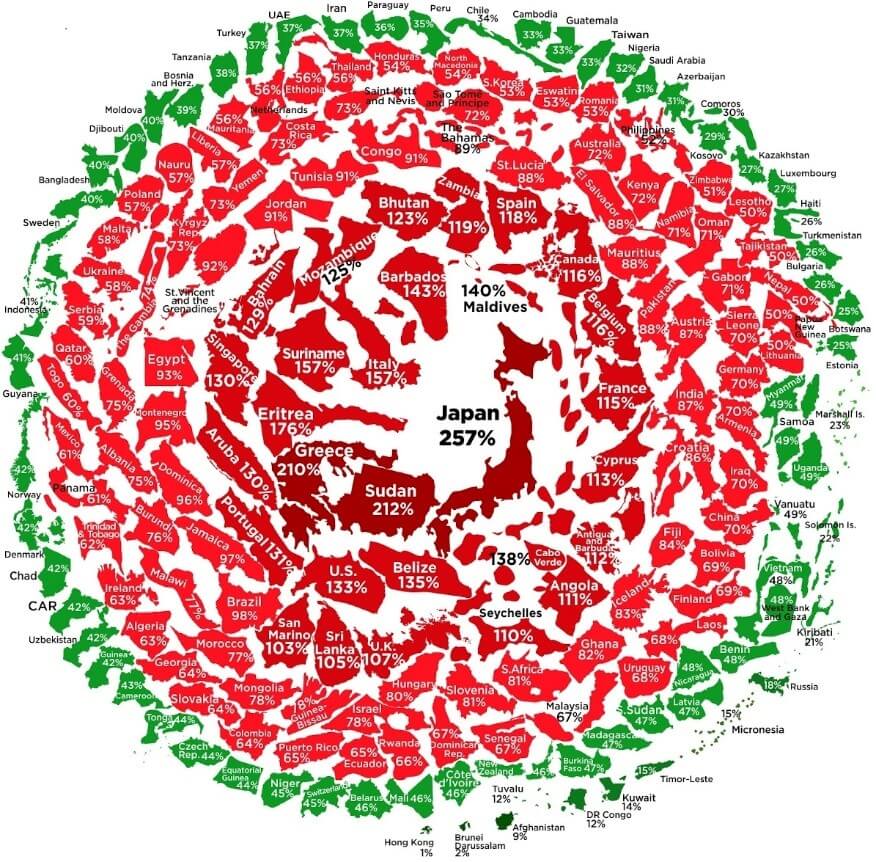
The indebtedness ratios of the states are given in Figure 1. According to the figure, the top five debtor states are mainly Japan, Sudan, Greece, Italy and the USA. Japan, the most indebted
country, owes its annual output at approximately 2.57 times its GDP. It is followed by Sudan with 2.12 times, Greece with 2.10 times, Italy with 1.57 times and the USA with 1.33 times. This ratio is 0.37 in Turkey. We may wonder how developed countries such as Japan and the USA survive with these debt ratios.
One of the important pillars of business going well in the economy is the continuation of the trust in the country’s currency and the acceptance of the country’s currency in the international arena. Another reason why indebtedness is so large does not cause problems is undoubtedly the strong industrial production of these countries. Interest rates in Japan are “0”, if it is 1, the government will have difficulty in paying its debt and the risk of collapse of the economy arises.
Figure 2. Total Global Debt to GDP

Source: IIF Global Debt Monitor Database
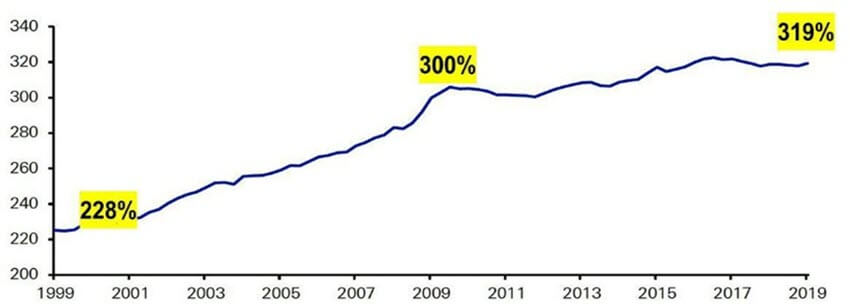
The graph showing the ratio of total government debt to global production (GDP) globally is given in Figure 2. When we look at the graph, we see that the total global government debt was 2.28 times the total production in 1999, 3 times in 2009 and 3.19 times in 2019. This ever-increasing debt on a global scale gives an idea about how fragile countries are in general in the financial crisis we are in.
Leave a Reply