Arzu Alvan · arzualvan.com · March 2026
────────────────────────────────────────────────────────────
There is a strange silence that can fall over a battlefield. Not the silence of peace, but the silence of something withheld—a breath the world is holding, waiting for an echo that never comes. In financial markets, geopolitical crises are supposed to be the explosions, and precious metals—gold and silver—are the sound, the immediate, reverberating alarm that signals a flight to safety. For decades, this has been the reliable cadence of global uncertainty. A conflict erupts, a border is crossed, a missile is launched, and the prices of gold and silver surge as investors abandon risk and seek the tangible security of an asset that has endured for millennia.
But what happens when the explosion is deafening, yet the alarm remains quiet?
In the recent, perilous escalation of conflict between Iran, Israel, and the United States, the world watched with bated breath. Military strikes were launched, threats were exchanged, and the vital arteries of global trade felt the tremor of potential disruption. By all historical measures, this was the very definition of a geopolitical shock that should have sent precious metals soaring. Yet the reaction was curiously muted. There was no sustained, panicked buying. The price action was hesitant—a flicker where a firestorm was expected.
As an economist, I have learned that when a market fails to behave as expected, it is rarely because the old rules no longer apply. It is usually because a new, more powerful rule has superseded them. The muted response of precious metals is not a sign that their role as a safe haven is over. It is a symptom of a profound transformation in the structure of modern commodity markets—a world where the price of a physical ounce of metal is no longer determined solely by the real-world balance of supply and demand, but is heavily influenced by the colossal weight of “paper” derivatives traded by a handful of powerful algorithmic firms [1, 5].
The problem is not that the alarm is broken. The problem is that someone may have their hand pressed firmly over the bell.
1. The Dog That Didn’t Bark: Precious Metals in the Face of Conflict
The period from late 2023 through the spring of 2024 was marked by a dramatic escalation of tensions in the Middle East, spiraling from the Israel-Hamas conflict into direct military exchanges involving Iran and the United States. On March 2, 2026, reports of joint U.S.-Israeli strikes on Iranian targets sent a shockwave through global markets [14]. Gold did react, surging to $5,390 an ounce—a significant jump driven by the immediate fear factor [15]. Silver, its more volatile sibling, followed suit, though with less vigor. However, the powerful, sustained rally that many market veterans anticipated failed to materialize. Silver, despite a backdrop of high inflation, persistent geopolitical risk, and strong industrial demand, fell over 30% from its January 2026 high, including a sharp 6.6% drop on a single day [1, 5, 17].
Is this time different? Let me walk through the historical record.
The narrative of gold as a crisis hedge is deeply embedded in the financial psyche, but the data reveals a more nuanced reality. While geopolitical shocks almost always trigger an initial price spike, the longevity and magnitude of that rally depend on a host of other factors [13, 16]. To contextualize the recent events, I have analyzed the performance of gold and silver across six major crises over the past fifty years.
| Crisis Event | Period | Gold Δ% | Silver Δ% |
| 9/11 Attacks | Sep–Dec 2001 | -3.83% | +4.47% |
| Gulf War II | Mar–May 2003 | +2.76% | +8.01% |
| 2008 Financial Crisis | Sep 2008–Mar 2009 | +16.96% | +0.27% |
| COVID-19 Pandemic | Feb–May 2020 | +7.44% | -15.74% |
| Ukraine War | Feb–May 2022 | -3.12% | -10.63% |
| Iran-US-Israel Tensions | Oct 2023–Apr 2024 | +23.89% | +21.39% |
Table 1: Gold and silver price changes during major geopolitical crises (1974–2024). Source: Author’s analysis of historical market data [13, 15, 16].
The data reveals a complex picture. Following the 9/11 attacks and the start of the Ukraine War, gold prices were actually lower several months later. During the initial COVID-19 shock, silver plummeted as fears of industrial slowdown and a dash for cash overwhelmed its safe-haven appeal. The recent Iran-US-Israel tensions did produce a strong medium-term rally—but the real anomaly lies in the price action after the most acute phase of conflict began, and particularly in silver’s persistent weakness. This suggests that other, more powerful forces are at play.
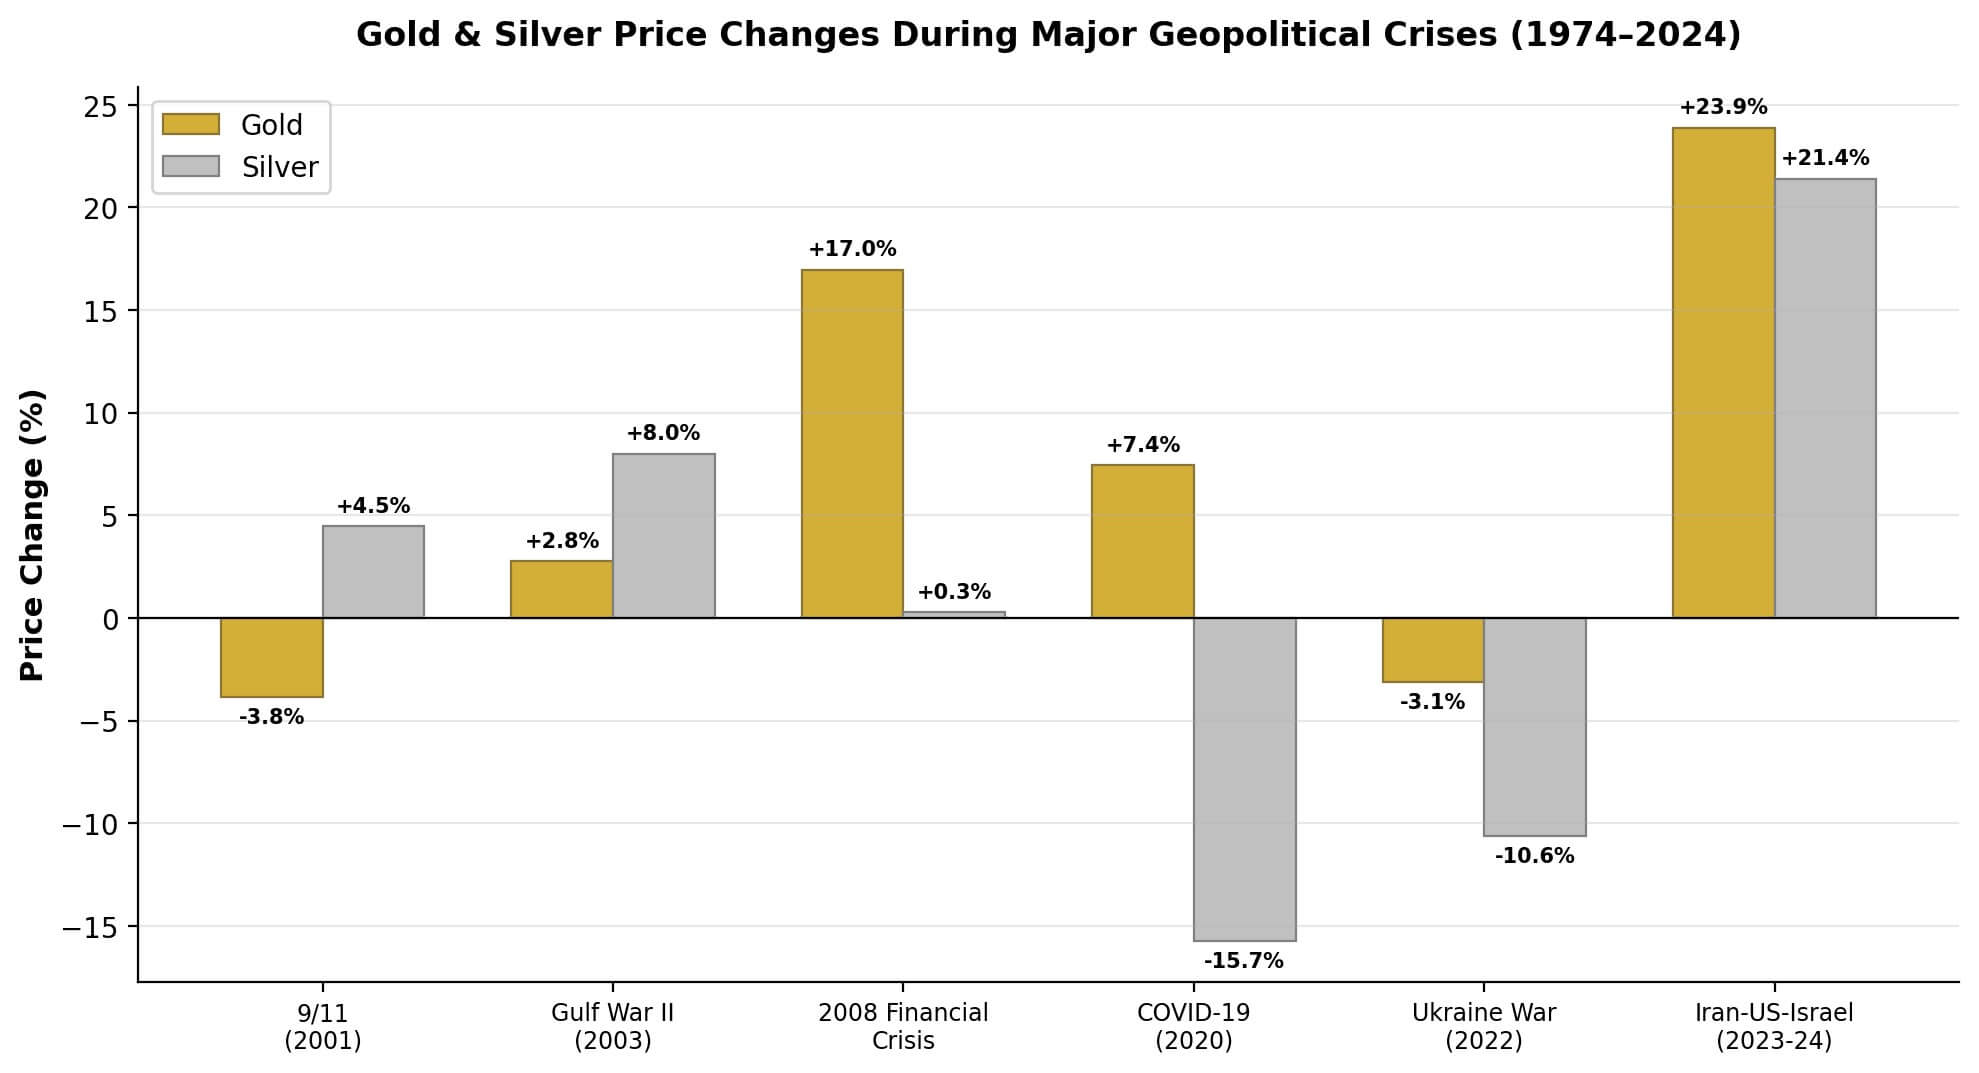
Figure 1: Gold and silver price changes during major geopolitical crises. The chart illustrates that while crises often cause initial spikes, the sustained trend is not always positive—indicating a complex relationship between geopolitical risk and precious metals pricing. Source: Author’s analysis [13, 16].
2. A Half-Century of Crises: Deconstructing the Safe-Haven Myth
The common wisdom that “war is good for gold” is an oversimplification that can be misleading. Think of it this way: the market is a forward-looking mechanism, and it often operates on the principle of “buy the rumor, sell the fact.” Gold and silver prices frequently rise in the anticipation of a conflict, as tensions build and uncertainty mounts. However, once the conflict actually begins, the price can often stagnate or even fall [13].
The duration and economic consequences of a war are what truly determine its long-term impact on precious metals. Short, contained conflicts tend to have only a fleeting effect. It is the long, drawn-out wars that fundamentally alter the economic landscape. The Vietnam War is a prime example. The immense cost of funding the war put enormous strain on the U.S. budget—a key factor leading President Nixon to sever the dollar’s final link to gold in 1971, ending the Bretton Woods system [13]. Freed from the discipline of gold convertibility, the U.S. was able to finance its deficits through currency creation, ushering in a decade of high inflation and fueling the spectacular gold bull market of the late 1970s.
In the current environment, another powerful, long-term factor is at play: a structural breakdown of trust in the global monetary system. Following the weaponization of the U.S. dollar through sanctions—particularly against Russia—central banks around the world have been accumulating gold at a historic pace [13, 18]. Since the invasion of Ukraine, central banks have added over 3,000 tonnes of gold to their reserves. This is not a speculative trade; it is a strategic shift away from a U.S. dollar-centric system. This steady, price-insensitive buying from official institutions provides a strong underlying bid for gold—which is likely a more significant long-term driver than the day-to-day headlines from any single conflict.
3. The Rise of the Paper Giants: How Market Structure Changed
To understand the strange behavior of precious metals today, we must appreciate how radically the structure of commodity markets has changed. For most of the 20th century, commodity futures markets were populated by a diverse array of participants—producers, consumers, and speculators. Holdings were distributed, and no single entity could easily dominate price discovery.
The dawn of the electronic age changed everything. The evolution of algorithmic trading—which began with simple, rules-based execution systems in the 1970s—has culminated in the era of High-Frequency Trading (HFT) [28, 29, 32]. Today, a small number of sophisticated quantitative firms use powerful computers to execute millions of trades in fractions of a second. This technological shift has had two profound consequences.
First, it has enabled a massive concentration of trading power. While in the 1990s it was rare for any single institution to control more than 10–15% of a major commodity futures market, today it is not uncommon to see single entities holding positions approaching 40% [11]. Second, it has amplified the influence of “paper” markets over the physical price. The primary global reference price for gold and silver is set not in a physical marketplace but on derivative exchanges like the COMEX [11]. Here, the volume of paper claims on metal can vastly exceed the amount of physical metal available for delivery. A firm with enough capital can exert enormous influence on the paper price, and that paper price will, in turn, set the price for the entire physical market.
4. The Anatomy of Manipulation: Spoofing and the Modern Playbook
In the world of high-frequency trading, one of the most pervasive forms of manipulation is a practice known as spoofing. The tactic is deceptive in its simplicity: a trader places a large order with no intention of ever letting it execute. This “spoof” order creates a false impression of market depth—a mirage of supply or demand. Other participants react, and the spoofer uses their reaction to execute a genuine order on the opposite side at a more favorable price. The entire sequence happens in milliseconds [3, 4]. Lawmakers banned the practice in the 2010 Dodd-Frank Act, but detection remains a significant challenge for regulators [10].
No case better illustrates the scale of this problem than the landmark enforcement against JPMorgan Chase & Co. In September 2020, the U.S. Commodity Futures Trading Commission (CFTC) ordered the bank to pay a record-breaking $920 million for manipulative conduct, including widespread spoofing in precious metals and U.S. Treasury futures markets [4, 6, 10]. The misconduct spanned at least eight years, involved hundreds of thousands of spoof orders, and at least 15 traders—causing over $300 million in losses to other market participants [9].
| Institution | Year | Penalty | Allegation |
| JPMorgan Chase | 2020 | $920 million | Spoofing in precious metals & Treasuries |
| Scotiabank | 2020 | $127.4 million | Precious metals price manipulation |
| Deutsche Bank | 2016/2018 | $38M + $47M | Silver price-fixing conspiracy |
| Barclays | 2014 | £26 million | London Gold Fixing manipulation |
Table 2: Major regulatory enforcement actions against financial institutions for precious metals manipulation. Source: CFTC, SEC, and UK regulatory filings [4, 6, 7, 10].
These cases demonstrate that the manipulation of precious metals markets by some of the world’s largest financial institutions is not a fringe conspiracy theory. It is a documented fact, proven by regulators and admitted to by the banks themselves.
5. The Case of Jane Street: A Shadow Over Silver?
This brings us to the present—and to a new and powerful player whose moves have sent ripples of unease through the precious metals community. Jane Street Capital is one of the largest and most secretive quantitative trading firms in the world. In the fourth quarter of 2025, the firm increased its holdings in the iShares Silver Trust (SLV)—the largest silver-backed ETF—by a staggering 20.6 million shares [1, 5]. That is not a typo. It was a more than 500-fold increase from the previous quarter, bringing its total position to approximately $1.3 billion.
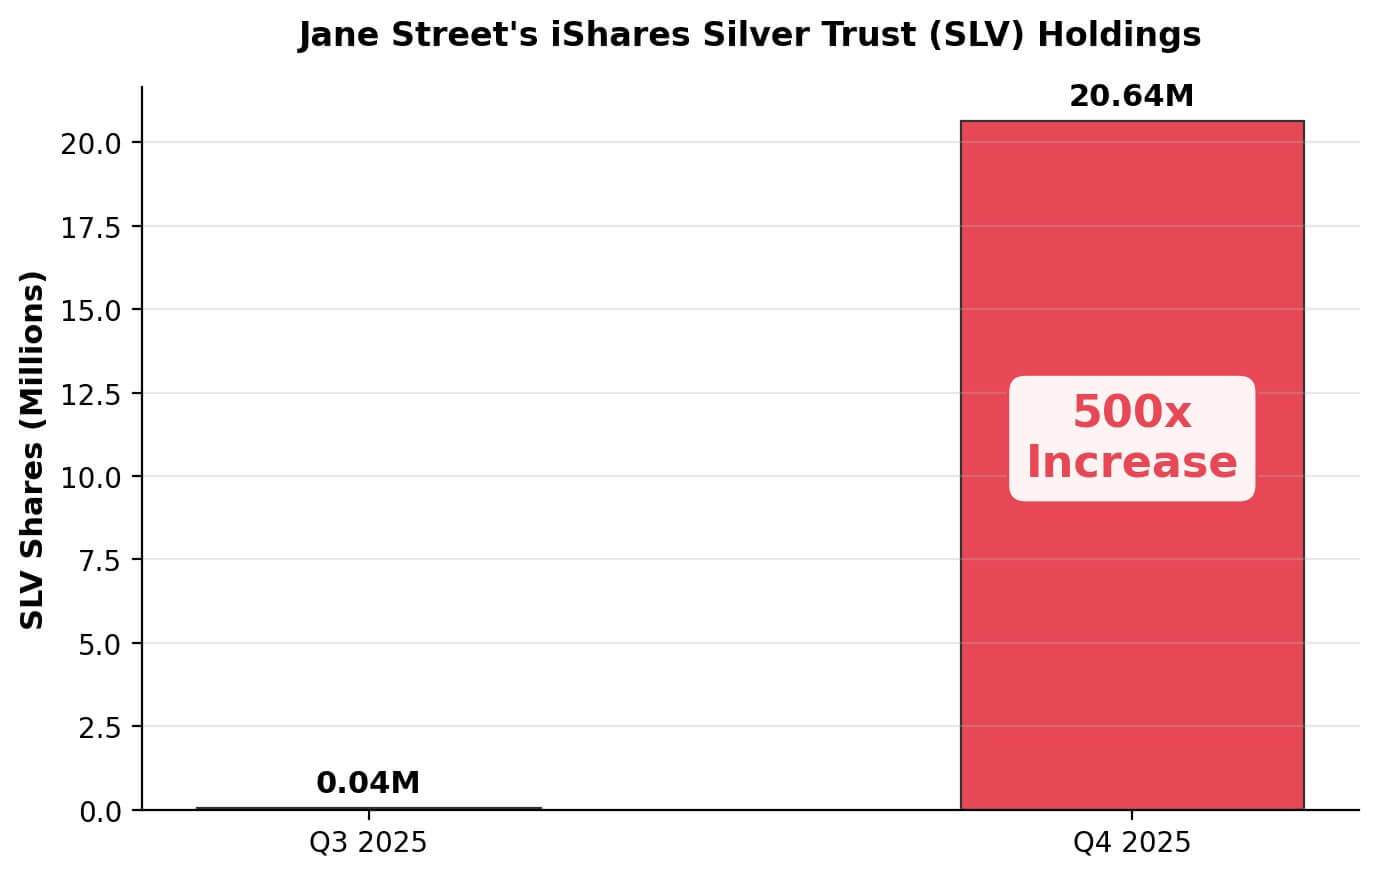
Figure 2: Jane Street’s iShares Silver Trust (SLV) holdings surged over 500x in a single quarter, making it the largest declared holder of the fund. Source: SEC filings, author’s analysis [1, 5].
With this single move, Jane Street became the largest declared holder of the SLV, surpassing even BlackRock, the fund’s own manager. The concern is that a massive position in the SLV, combined with potentially larger and more opaque positions in futures and options, could give a single firm the power to heavily influence the price of silver. This concern is amplified by the fact that the custodian for the physical silver backing the SLV is JPMorgan—the same bank that paid nearly a billion dollars for manipulating precious metals markets for years [1, 5].
While no regulator has yet announced a formal investigation into Jane Street’s silver activities, the firm faces serious allegations of market manipulation in three other asset classes:
- Cryptocurrency (Terra/Luna): The bankruptcy administrator for Terraform Labs alleges Jane Street profited from an unfair informational advantage, withdrawing 85 million UST tokens minutes before a destabilizing event [1, 5].
- Indian Equities (Bank Nifty): India’s SEBI accused the firm of a two-phase manipulative scheme across 18 derivatives expiry days, ordering it to deposit approximately $566 million in alleged unlawful gains [1, 2, 5].
- Bitcoin (“10 AM Dump”): Traders documented a coordinated pattern of large Bitcoin sell-offs at approximately 10 a.m. daily, which reportedly ceased after the Terraform lawsuit became public [1, 5].
These allegations—spanning equities, cryptocurrencies, and now raising questions in commodities—suggest a potential pattern. Jane Street denies all allegations. But the accusations from multiple, independent sources, including a major national regulator, combined with its unprecedented position in the silver market, have created a palpable sense of unease.
6. The Dollar’s Domain: DXY and Its Evolving Relationship with Gold
No analysis of precious metals is complete without examining the role of the U.S. dollar. The U.S. Dollar Index (DXY) has historically had a strong inverse relationship with the price of gold [18, 20]. The logic is intuitive: because gold is priced in dollars globally, a stronger dollar makes it more expensive for buyers using other currencies, dampening demand. For decades, traders have used this inverse correlation as a reliable rule of thumb—strong dollar, weak gold; weak dollar, strong gold.
However, in 2023 and 2024, this relationship began to break down. In a striking departure from historical norms, both gold and the DXY demonstrated significant strength simultaneously [18, 19]. Quantitative models from BNY Mellon confirm this shift: the correlation coefficient between the DXY and gold fell dramatically from -0.78 in 2020 to just -0.32 in early 2025 [19].
| Year | DXY Level | Gold Price ($/oz) | Correlation (r) |
| 2015 | 98.6 | $1,060 | -0.78 |
| 2018 | 96.2 | $1,282 | -0.68 |
| 2020 | 89.9 | $1,898 | -0.55 |
| 2022 | 104.5 | $1,824 | -0.41 |
| 2024 | 104.1 | $2,623 | -0.35 |
| 2025 (est.) | 106.8 | $3,100 | -0.32 |
Table 3: The declining inverse correlation between the DXY and gold prices (2015–2025). Source: BNY Mellon, CME Group, author’s analysis [18, 19, 20].
Several powerful forces drive this decoupling: dual safe-haven demand in an era of widespread geopolitical instability, strategic central bank diversification away from the dollar, and persistent inflation concerns keeping gold attractive even when the dollar is strong [13, 18, 19]. Investors are increasingly focused on real interest rates—nominal rates minus inflation—and when real rates are low or negative, gold becomes very attractive regardless of the dollar’s nominal strength.
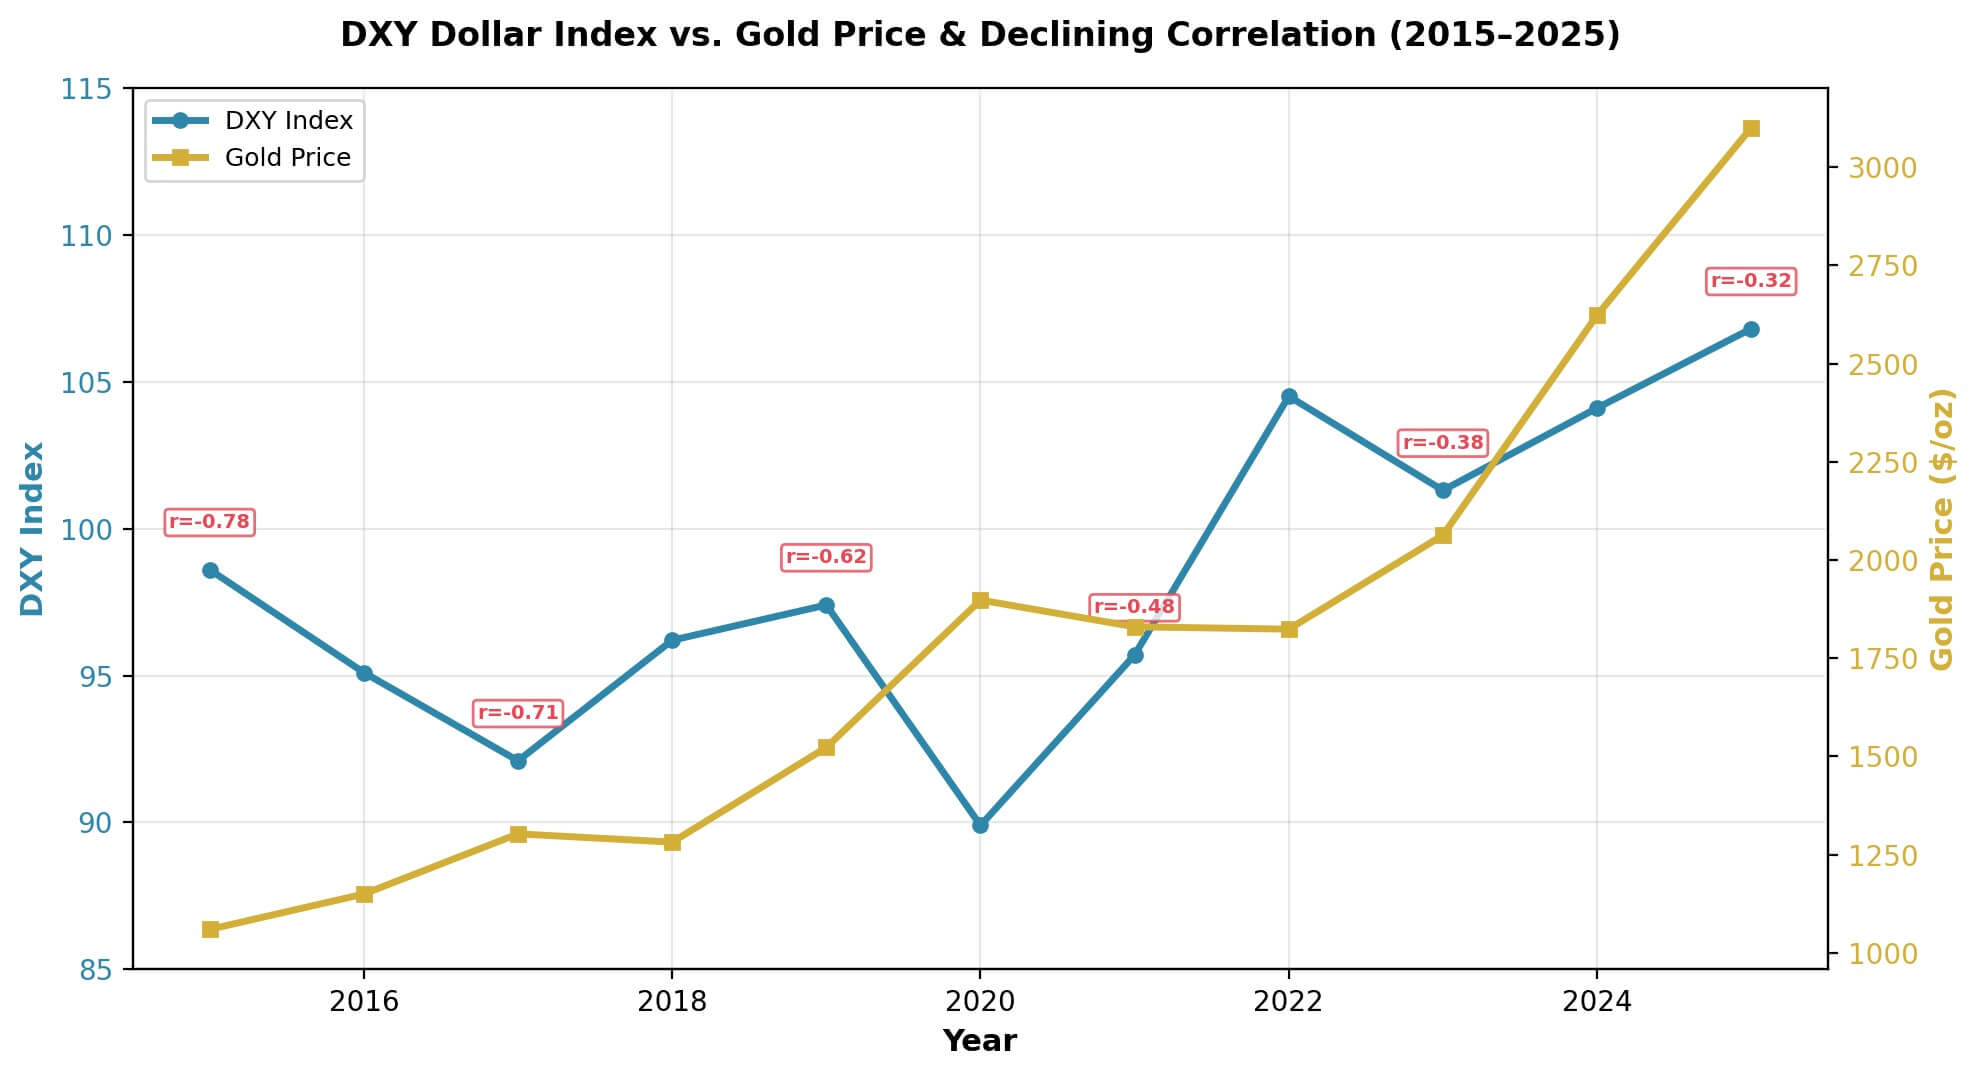
Figure 3: DXY Dollar Index vs. gold price with declining correlation (2015–2025). The traditional inverse relationship is weakening, suggesting gold is increasingly driven by structural factors independent of dollar strength. Source: BNY Mellon, CME Group, author’s analysis [18, 19, 20].
This decoupling is critical. It means the traditional headwind of a strong dollar is no longer the powerful suppressor of gold that it once was. Gold is marching to the beat of its own drum—driven by global risk, central bank policy, and real interest rate trends. The fact that gold has performed well despite a strong dollar makes silver’s concurrent weakness even more perplexing and reinforces the suspicion that market-specific, structural factors—such as the concentrated paper positions held by firms like Jane Street—are playing an outsized role.
Conclusion: The Weight of Paper in a World of Risk
We return to the silence. The geopolitical explosions came, but the safe-haven alarm in the precious metals market—particularly for silver—was strangely muffled. The historical record shows us that the relationship between war and gold is complex, driven more by the long-term monetary consequences of conflict than by the initial shock itself. But the recent price action points to something more immediate and structural.
The market for precious metals is no longer a simple contest between miners, jewelers, and investors. It is a high-tech arena dominated by quantitative giants wielding algorithms of unimaginable speed and complexity. The documented history of manipulation by the world’s largest banks has proven that the paper markets for gold and silver are vulnerable to being systematically distorted. The allegations now surrounding Jane Street Capital, combined with its unprecedented dominance in the silver ETF market, suggest that these practices may not be a thing of the past.
The traditional forces of supply, demand, and geopolitical fear have not vanished. The massive gold buying by central banks and the decoupling of gold from the U.S. dollar are powerful bullish undercurrents. But they are pushing against a formidable weight—the colossal, leveraged power of the paper markets. A single firm, through a combination of ETF shares, futures, and options, can potentially exert enough downward pressure to absorb waves of physical buying, keeping a lid on prices and profiting from the manufactured stability.
The fire alarm is not broken. The sound is being suppressed. For investors, the lesson is clear: in this new era, it is not enough to simply watch the headlines and buy on fear. One must also understand the plumbing of the market itself. The future price of gold and silver will be determined not just by the next crisis, but by the ongoing battle between the tangible demand for a physical safe haven and the immense, intangible weight of paper claims—traded in the silent, digital war rooms of modern finance.
The signs are all there. The question is whether we, unlike in so many past crises, will choose not to look away.
Key Concepts Translated for Practical Understanding
Safe Haven: An asset that investors flock to during times of uncertainty. Gold is the classic example—it holds value when stocks, bonds, and currencies are under stress.
Spoofing: An illegal trading tactic: placing a large fake order to create a false impression of demand or supply, tricking others into trading at artificial prices, then canceling the fake order.
High-Frequency Trading (HFT): Using powerful computers to execute millions of trades per second. Think of it as a chess grandmaster who can see and move a thousand pieces simultaneously—while you are still deciding your first move.
DXY (Dollar Index): A financial index measuring the U.S. dollar’s strength against a basket of six major currencies (Euro, Yen, Pound, Canadian Dollar, Swedish Krona, Swiss Franc).
Paper Markets: Derivatives exchanges where financial contracts representing claims on commodities are traded. In precious metals, the volume of these “paper” claims can vastly exceed the physical metal available.
Real Interest Rate: The nominal interest rate minus the inflation rate. When real rates are negative, holding cash loses value—making assets like gold more attractive.
SLV (iShares Silver Trust): The largest silver-backed ETF. Each share represents fractional ownership of physical silver held by a custodian (JPMorgan Chase).
────────────────────────────────────────────────────────────
Disclaimer: This text is for informational and educational purposes only. It is not investment advice. The allegations described regarding Jane Street Capital are unproven at the time of writing. All data and analysis are based on publicly available sources.
References & Data Sources
[1] “Jane Street’s $1.3B Silver Bet Fuels Fears.” Rolling Out, March 3, 2026.
[2] “Jane Street and the Expiry Day Trap: Unpacking SEBI’s Crackdown.” Oxford Business Law Blog, July 2025.
[3] “Consequences of Spoofing: Precious Metals Traders Pay a Steep Price.” Nasdaq.
[4] CFTC. “Orders JPMorgan Chase & Co. to Pay $920 Million for Manipulative Conduct.” September 29, 2020.
[5] “Why Is Silver Falling? Jane Street’s $1.3B SLV Bet Sparks Manipulation Debate.” TradingView, 2026.
[6] CFTC Press Release 8260-20. “CFTC Orders JPMorgan to Pay Record $920 Million.” September 2020.
[7] “Gold Manipulation: How Precious Metals Price Fixing Led to Fraud.” Gold IRA Guide.
[8] SEC. “Charges J.P. Morgan Securities for Manipulative Trading in U.S. Treasury Securities.” 2020.
[9] “JPMorgan’s ‘spoofing’ scandal, explained.” Fortune, September 30, 2020.
[10] “JPMorgan to pay $920M to settle spoofing charges across 3 agencies.” Banking Dive, 2020.
[11] “JP Morgan Silver Market Control Analysis 2025.” Discovery Alert.
[13] “How Does War Affect the Gold and Silver Price?” Gold Survival Guide.
[14] “How U.S. Involvement in Israel-Iran War Could Impact Gold Prices.” Atlanta Gold & Coin.
[15] “Gold Surge on Iran Strikes.” FX Empire, 2026.
[16] “Israel-Iran conflict: Impact on oil prices, gold, equities and bonds.” Julius Baer.
[17] “Gold retreats on strong dollar, tempered rate-cut bets.” Reuters, March 3, 2026.
[18] “Gold and the U.S. Dollar: An Evolving Relationship?” CME Group, 2025.
[19] “DXY Stability and Precious Metals Decoupling: A New Era.” MEXC Research.
[20] “Why Gold Moves When the Dollar Moves.” Phillip Nova.
[28] “Algorithmic Trading Evolution Since 1980s.” NURP.
[29] “Algorithmic Trading.” Wikipedia.
[32] “Evolution of Algorithmic Trading: Past, Present, and Future Trends.” MidsCapital.