House prices, shipping stocks, and the S&P 500 in a world that never learns
Sometimes the global economy feels like a neighborhood where the same house keeps catching fire. Different years, different neighbors, but somehow the same smoke. Here I look at three markets that react to stress with three different personalities: U.S. house prices, a basket of shipping stocks, and the S&P 500.
1) House prices: slow, stubborn, and sometimes too confident
House prices do not behave like a daily referendum. They move slower. That slowness is not always stability; sometimes it is delayed reaction. Still, the curve is very informative.

Figure 1. U.S. house prices (FRED: CSUSHPINSA).
Table 1. Monthly return summary (simple returns)
| Series | Mean | Std | Min | Max | Obs |
| Housing | 0.0054 | 0.0071 | -0.0112 | 0.0271 | 117 |
| SP500 | 0.0118 | 0.0437 | -0.1251 | 0.1268 | 117 |
| Shipping | 0.0215 | 0.1158 | -0.2998 | 0.4118 | 117 |
2) Shipping stocks: loud markets in a loud world
Shipping equities are not just about ships. They price anxiety about routes, fuel, inventories, trade volume, and political risk. When the world becomes uncertain, they usually do not whisper.
Shipping basket uses equal-weight monthly returns across available tickers on Stooq. Included: ZIM.US, SBLK.US, GNK.US, GSL.US, DAC.US, ESEA.US, NAT.US, STNG.US.
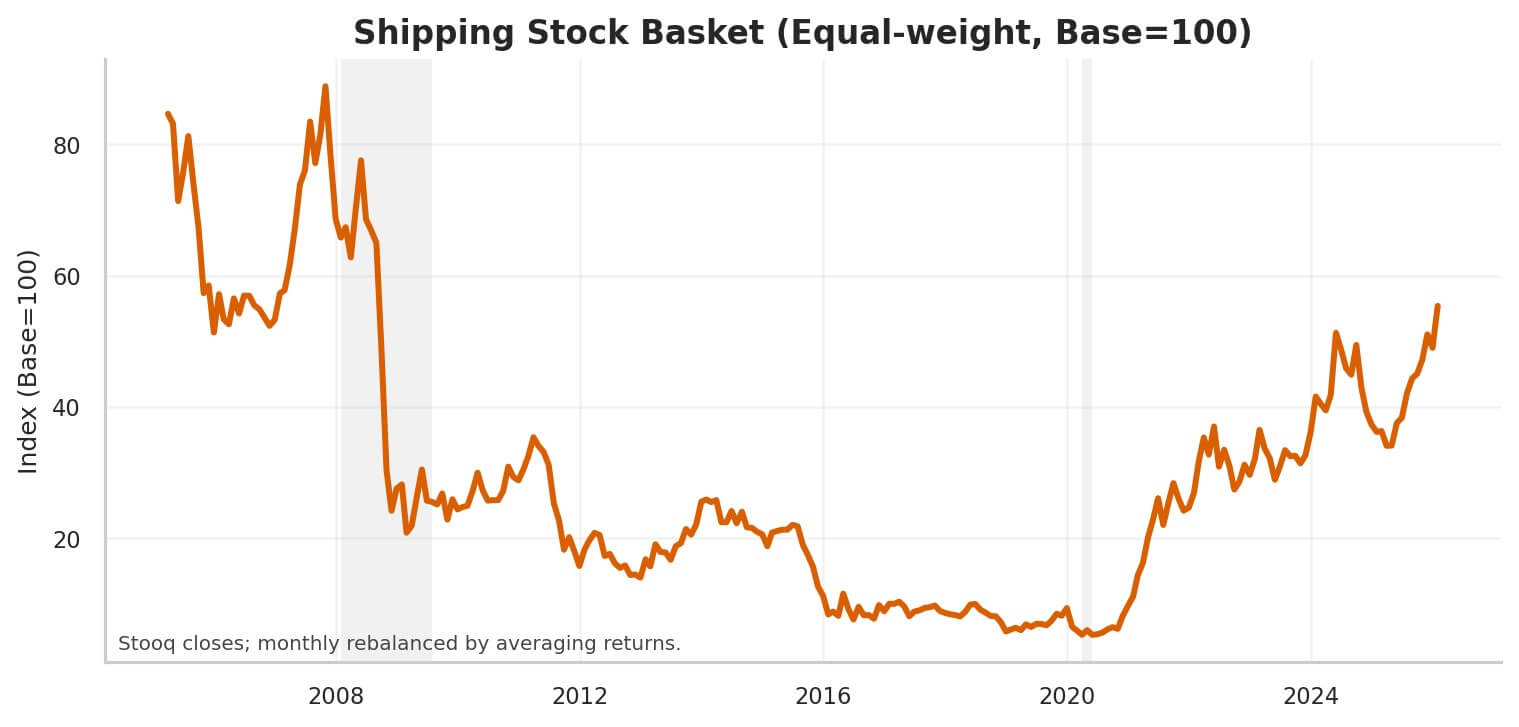
Figure 2. Shipping stock basket (equal-weight, base=100).
3) The S&P 500: the headline market
The S&P 500 is the market everyone reads like a newspaper. Sometimes it forecasts. Sometimes it panics. But it always sends a signal.

Figure 3. S&P 500 index level (FRED: SP500).
4) Put them on the same scale: behavior becomes the data
Here is the comparison that I personally like the most: make them all 100 at the same starting point. Then you can see who runs, who freezes, and who pretends nothing happened.

Figure 4. Normalized series (all = 100 at the first common month).
Table 2. Correlations (monthly returns)
| Housing | SP500 | Shipping | |
| Housing | 1.000 | -0.009 | 0.226 |
| SP500 | -0.009 | 1.000 | 0.347 |
| Shipping | 0.226 | 0.347 | 1.000 |
5) A “cough meter”: do shipping and equities breathe together?
This rolling correlation is not a perfect statistic, but it is a good storyteller. When it rises, you can feel that markets are reacting to a common stress. When it falls, the stress is more specific.

Figure 5. Rolling 36-month correlation (shipping basket vs S&P 500 returns).
Table 3. Simple regression: Shipping returns on S&P 500 returns (monthly)
| Metric | Value |
| Alpha (monthly) | 0.0106 |
| Beta vs S&P 500 | 0.9199 |
| R-squared | 0.1207 |
| Observations | 117 |
Methodology (transparent, not fancy)
Housing: FRED series CSUSHPINSA (downloaded as daily/periodic observations; aggregated to month-end).
S&P 500: FRED series SP500 (daily; aggregated to month-end).
Recessions: FRED series USREC (monthly recession indicator).
Shipping basket: Stooq daily closes → month-end closes → equal-weighted by averaging monthly returns.
Returns: simple monthly returns.
Rolling correlation: 36-month window.
Regression: OLS of shipping returns on S&P 500 returns with intercept.
Citations / data notes
[1] Federal Reserve Bank of St. Louis, FRED. Series: CSUSHPINSA, SP500, USREC. Accessed 2026-01-31.
[2] Stooq historical market data. Tickers used (if available): ZIM.US, SBLK.US, GNK.US, GSL.US, DAC.US, ESEA.US, NAT.US, STNG.US. Accessed 2026-01-31.
Limitations: (i) equity prices are not freight rates; (ii) dividends are excluded; (iii) the basket may suffer from availability/survivorship; (iv) SP500 is not a total return index here.
Closing thought
Global crises do not always invent new plots. Very often they reuse the same plot and just change the costume. If you can read the behavior of these three markets together, you can sometimes see the costume change earlier.