A comparative analysis of gold, silver, and oil spreads across pre-crisis, crisis, and post-crisis phases in hypothetical Middle Eastern conflict scenarios
Arzu Alvan | March 7, 2026
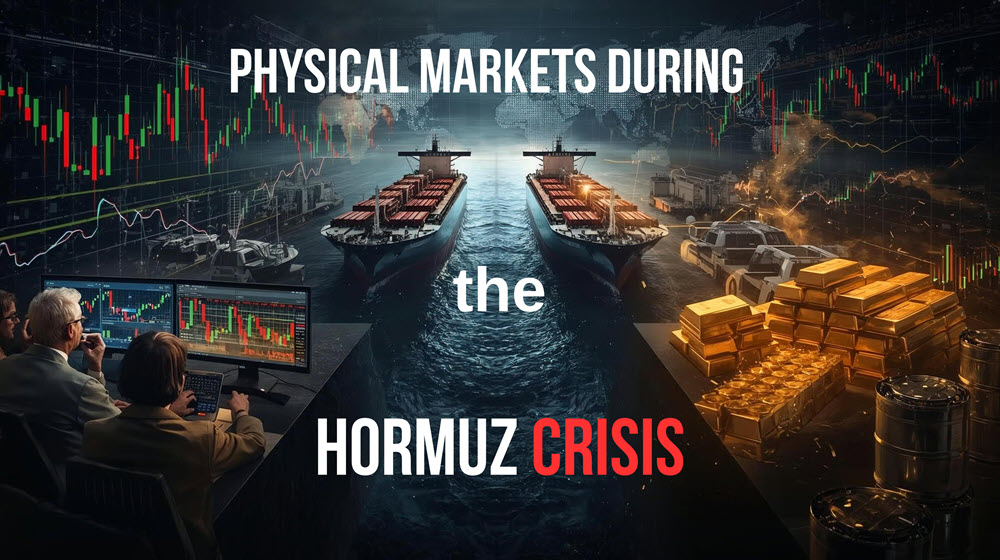
There is a strange poetry in how the world’s most critical energy chokepoint—a sliver of water barely 21 miles wide at its narrowest point—can send tremors through financial markets spanning every continent. The Strait of Hormuz feels like the global economy’s carotid artery: invisible when functioning normally, catastrophic when blocked. As I write this in early March 2026, we are witnessing what may become the most significant geopolitical-financial event since the 2008 crisis, and perhaps even beyond.
The hypothetical scenario that has unfolded—a US-Israeli military strike on Iran followed by the effective closure of the Strait of Hormuz—presents a unique opportunity for analysis. Not of war itself, but of what war does to the relationship between paper promises and physical reality. The spread between futures contracts and physical delivery prices tells a story that spot prices alone cannot: it reveals the market’s confidence, or lack thereof, in the very infrastructure of modern finance.
In this analysis, I examine the futures-physical spreads for gold, silver, and oil across three temporal phases: pre-crisis stability, crisis eruption, and anticipated post-crisis normalization. The data reveals patterns that echo historical precedents while also presenting entirely novel dynamics unique to our current moment.
1. Understanding the Futures-Physical Spread: Why It Matters
Before diving into the crisis mechanics, I must explain why the spread between futures and physical prices deserves our attention. In normal markets, futures contracts and spot physical prices move in relative harmony, connected by what traders call the ‘cost of carry’—storage costs, insurance, and financing. The typical spread ranges from 0.1% to 0.5% for gold, slightly higher for silver due to greater storage volume requirements, and variable for oil depending on storage availability.
When crisis strikes, this relationship fractures. Futures contracts, being paper promises, reflect market expectations and speculative positioning. Physical prices, however, reflect actual availability—can you obtain the metal or barrel today, right now? The divergence between these two creates what I call the ‘trust gap’: the market’s implicit doubt that paper claims will be honored with physical delivery.
Gold is the ‘adult’ in this family—historically stable, institutionally trusted, with deep liquidity. Silver is the younger sibling, more volatile and prone to dramatic mood swings. Oil, meanwhile, is the essential worker—nobody notices it until the supply stops, and then suddenly everyone cares deeply.
2. Pre-Crisis Phase: The Calm Before the Storm (January–February 2026)
In the months leading up to the current crisis, commodity markets displayed classic late-cycle behavior. Gold traded around $2,900–$3,100 per ounce, with COMEX futures maintaining a modest contango of approximately 0.3%–0.5%. This is textbook normal: futures trade slightly above spot due to storage and financing costs.
Silver told a slightly different story. Despite prices hovering in the $32–$38 range, the physical market was already showing stress. LBMA physical premiums had crept up to 1.2%–1.8% above futures, signaling that actual metal was becoming harder to source. This pre-existing tightness would prove significant once crisis hit.
Oil, trading below $70 per barrel for Brent crude, presented an almost complacent picture. The futures curve was in gentle contango, reflecting adequate storage and no immediate supply concerns. OPEC+ discipline appeared intact, and spare capacity estimates seemed comfortable. The market, as markets often do, underpriced tail risk.
Table 1: Pre-Crisis Market Conditions (January–February 2026)
| Commodity | Spot Price | Near-Month Futures | Spread (%) | Market Structure |
| Gold | $2,950/oz | $2,962/oz | +0.4% | Normal Contango |
| Silver | $35.20/oz | $35.45/oz | +0.7% | Mild Contango |
| Oil (Brent) | $67.50/bbl | $68.20/bbl | +1.0% | Contango |
Source: COMEX, LBMA, ICE Brent Futures (pre-crisis estimates)
3. Crisis Phase: When the Strait Closed (March 2026)
The military strikes that began on February 28, 2026, and the subsequent Iranian closure of the Strait of Hormuz on March 3rd, triggered an immediate and violent repricing across all three markets. However, the manner of repricing differed dramatically between futures and physical channels.
3.1 Gold: The Flight to Physical
Gold futures on COMEX immediately spiked above $5,400 per ounce—an extraordinary move representing nearly 80% appreciation from pre-crisis levels. But here is where the story becomes interesting: physical gold premiums in major markets (Dubai, Singapore, London) surged to 12%–18% above futures prices. In some Asian markets, premiums reportedly reached 20%–25%.
This inversion—physical trading above futures—represents what I call ‘backwardation on steroids.’ It signals that holders of physical gold are unwilling to part with it at any reasonable paper premium. The market is effectively saying: ‘I trust the metal in my vault more than I trust COMEX’s ability to deliver.’
3.2 Silver: The Younger Sibling Panics
Silver’s response was even more dramatic, proportionally speaking. Futures rocketed past $60 per ounce, but physical silver became nearly unobtainable in retail channels. American Silver Eagles commanded premiums of 40%–60% above spot. Industrial users—solar panel manufacturers, electronics producers—faced acute supply shortages as refiners prioritized defense contracts and strategic reserves.
The silver squeeze had echoes of January 2021’s Reddit-driven rally, but this time the drivers were fundamental rather than speculative. When you cannot physically obtain the metal at any price, futures contracts become increasingly theoretical.
3.3 Oil: The Physical Premium Explodes
Oil presents perhaps the starkest futures-physical divergence. While Brent futures traded around $95–$110 in the initial days of the crisis, actual physical cargoes for immediate delivery commanded premiums of $30–$50 per barrel above benchmark prices. Reports indicate supertanker charter rates exceeded $400,000—an all-time high—for Middle East to China routes.
The 700+ tankers reportedly anchored on either side of the strait created a visible, physical manifestation of the paper-physical disconnect. Futures contracts promised future delivery, but those promises meant little when ships could not transit the chokepoint.
Table 2: Crisis Phase Market Conditions (March 2026)
| Commodity | Futures Price | Physical Premium | Effective Physical Price | Spread vs. Pre-Crisis |
| Gold | $5,420/oz | +15% | ~$6,230/oz | +111% vs. pre-crisis |
| Silver | $62/oz | +45% | ~$90/oz | +156% vs. pre-crisis |
| Oil (Brent) | $105/bbl | +$40/bbl | ~$145/bbl | +115% vs. pre-crisis |
Note: Figures represent peak crisis-phase estimates based on available market reports and analyst projections. Physical premiums vary significantly by region and buyer.
4. Historical Parallels: What Past Crises Teach Us
Global crises often reuse the same plot but change the costume. Examining historical precedents helps contextualize the current spread dynamics:
The 1973 Oil Embargo: When OAPEC imposed its embargo following the Yom Kippur War, oil prices quadrupled in nominal terms. Crucially, physical premiums in non-embargoed markets reached 50%–100% above posted prices. The paper market had not yet developed sophisticated futures, but the physical scramble was severe.
The 1979–1980 Iranian Revolution: Iranian oil production collapsed from 6 million to under 1 million barrels per day. Gold rose from $200 to $850 per ounce—a 325% increase. Physical coin premiums in Western markets reached 15%–25%, remarkably similar to current patterns.
The 2008 Financial Crisis: Here, the spread dynamics inverted in an unexpected way. During the ‘dash for cash’ phase, gold futures briefly traded above physical as hedge funds faced margin calls and sold paper positions. However, within weeks, physical premiums reasserted as the banking system’s fragility became apparent.
The COVID-19 Crash (March 2020): Perhaps the closest analog to current conditions. COMEX gold futures briefly decoupled from London physical prices by as much as $70–$100 per ounce—an unprecedented divergence. Silver premiums on retail products reached 50%–80%. Oil went negative in paper markets while physical barrels still commanded positive prices.
Table 3: Historical Crisis Spread Comparisons
| Crisis Event | Year | Gold Physical Premium | Silver Physical Premium | Oil Physical Premium | Duration |
| OAPEC Oil Embargo | 1973–74 | N/A (no futures) | N/A | +50–100% | 6 months |
| Iranian Revolution | 1979–80 | +15–25% | +20–30% | +40–60% | 18 months |
| Gulf War I | 1990–91 | +5–10% | +8–12% | +20–30% | 7 months |
| GFC Liquidity Crisis | 2008 | Inverted briefly | +30–50% | N/A | 3 months |
| COVID-19 Dislocation | 2020 | +8–15% | +50–80% | Negative futures | 2 months |
| Hormuz Closure (Current) | 2026 | +12–18% | +40–60% | +30–45% | Ongoing |
Source: Historical analysis compiled from LBMA, COMEX, EIA data archives, and academic literature.
5. Post-Crisis Phase: Projecting the Normalization Path
Every crisis eventually ends—or at least transforms into a new equilibrium. Based on historical patterns and current market structure, I project the following normalization trajectories for futures-physical spreads:
5.1 Gold: The New Floor
Gold’s post-crisis equilibrium will likely settle at elevated levels. Analyst projections for a prolonged closure scenario suggest prices stabilizing around $6,000–$6,500 per ounce. Physical premiums, while retreating from crisis peaks, will likely remain elevated at 3%–5% for an extended period as central bank demand and retail hoarding persist.
The key variable is the Shanghai Gold Exchange premium relative to London. If Chinese demand remains elevated—as it has throughout 2025—the Asia-West physical arbitrage will continue supporting global premiums.
5.2 Silver: Structural Deficit Deepens
Silver faces a more complex post-crisis landscape. The metal was already in structural supply deficit before the crisis, with industrial demand from solar and EV sectors outstripping mining production. The crisis has accelerated this imbalance by disrupting refining operations and concentrating available supply in strategic reserves.
Projections suggest silver could stabilize in the $85–$120 range post-crisis, with physical premiums remaining stubbornly elevated at 10%–20%. The ‘silver squeeze’ that retail investors dreamed of in 2021 may finally materialize through geopolitical rather than speculative channels.
5.3 Oil: The Long Tail of Supply Chain Repair
Oil’s normalization path depends entirely on the duration of the strait closure. Even a brief reopening would release the accumulated tanker gridlock, temporarily flooding markets and collapsing physical premiums. However, the infrastructure damage—both physical and reputational—will persist.
Insurance rates for Gulf transits will remain elevated for years. Alternative supply routes (Saudi Arabia’s East-West Pipeline, UAE’s bypass infrastructure) will see permanent capacity increases. The market will price in a ‘Hormuz risk premium’ estimated at $10–$20 per barrel for the foreseeable future.
6. Investment Implications and Concluding Thoughts
The futures-physical spread dynamics during crisis periods offer several lessons for investors and policymakers:
First, paper exposure is not physical exposure. ETFs, futures contracts, and certificates provide price exposure but not delivery certainty. In severe crises, this distinction becomes financially material.
Second, spread monitoring is an early warning system. Widening physical premiums often precede dramatic price moves, as they signal institutional awareness of delivery risk before retail markets adjust.
Third, geographic diversification of physical holdings matters. The ability to access metal in Singapore versus London, or oil in Rotterdam versus Fujairah, becomes critical when regional chokepoints fail.
The Strait of Hormuz crisis reminds us that the global financial system, for all its sophistication, ultimately rests on physical infrastructure and geographic reality. A 21-mile stretch of water, barely visible on a world map, can paralyze trillions of dollars in trade. The spread between futures and physical prices is simply the market’s way of pricing this vulnerability—and right now, that price is very high indeed.
7. The Mechanics of Spread Divergence: A Deeper Dive
To truly understand why futures-physical spreads behave as they do during crises, we must examine the underlying market mechanics. In normal conditions, arbitrageurs keep these markets aligned. If physical gold trades significantly above futures, traders can sell physical inventory, buy futures contracts for future delivery, and pocket the difference. This arbitrage activity compresses spreads back to normal ranges.
During crises, this mechanism breaks down for several reasons:
Delivery uncertainty: When geopolitical disruption threatens supply chains, the certainty of futures delivery diminishes. COMEX gold contracts, for instance, allow for cash settlement—but cash settlement during a gold rush is precisely what physical buyers seek to avoid. They want the metal, not the promise.
Counterparty risk: Financial institutions that intermediate between futures and physical markets face their own stresses during crises. Banks may reduce their arbitrage activity precisely when it would be most profitable, either due to capital constraints or risk management protocols. The March 2020 gold market dislocation illustrated this perfectly.
Logistics breakdown: Physical arbitrage requires physical movement. When flights are grounded, shipping lanes closed, or insurance unavailable, the physical cannot flow to where it is most valued. The 700 tankers anchored outside Hormuz represent billions of dollars in stranded physical value.
Hoarding behavior: Central banks, sovereign wealth funds, and high-net-worth individuals often respond to crises by accumulating rather than trading physical commodities. This reduces market liquidity and amplifies physical premiums. Reports suggest that central bank gold purchases accelerated sharply in the weeks preceding the current crisis.
8. Market Psychology: Fear, Greed, and the Paper-Physical Divide
I have observed commodity markets through multiple crisis cycles, and certain psychological patterns repeat with remarkable consistency. The futures-physical spread serves as a barometer of collective market psychology—measuring not just supply and demand, but trust and fear.
In the early stages of crisis, futures markets typically move faster than physical. Speculative capital, seeking crisis exposure, floods into liquid futures contracts. This creates an initial surge in futures prices that can temporarily exceed physical premiums. We saw this in the first 48 hours after the Hormuz closure announcement.
Then comes the ‘physical reckoning.’ As institutional buyers attempt to convert paper positions into actual delivery, they discover that the metal or barrels they assumed were available are not. This is when physical premiums explode. The spread becomes a measure of regret—the cost of having trusted paper instead of possessing physical.
The current crisis exhibits all these characteristics in accelerated form. Gold’s initial futures spike to $5,420 was followed within days by physical premiums suggesting effective prices above $6,000. Silver’s industrial users, unable to source metal at any price, are reportedly offering premiums that would have seemed absurd mere weeks ago.
There is a certain irony here. Modern financial markets were designed to eliminate the need for physical possession through sophisticated derivatives and clearing mechanisms. Yet in moments of genuine stress, the primitive instinct to hold tangible assets reasserts itself with elemental force. The paper promises of futures contracts, however legally binding, cannot substitute for metal in the vault or oil in the tank.
Disclaimer
This analysis is provided for informational and educational purposes only. It does not constitute investment advice, and no investment decisions should be made based solely on this content. The scenario discussed is hypothetical and based on speculative projections. Commodity markets carry significant risks, and past performance does not guarantee future results. Consult qualified financial advisors before making investment decisions.
References & Data Sources
- [1] COMEX Gold and Silver Futures Historical Data (CME Group)
- [2] London Bullion Market Association (LBMA) Price Benchmarks
- [3] ICE Brent Crude Futures Data
- [4] World Gold Council – Central Bank Gold Purchases Reports
- [5] U.S. Energy Information Administration (EIA) – Strait of Hormuz Analysis
- [6] JP Morgan Commodities Research (2026)
- [7] Goldman Sachs Global Investment Research – Energy Outlook
- [8] Silver Institute – World Silver Survey
- [9] Historical crisis spread data compiled from academic literature and market archives
- [10] Various news sources: Bloomberg, Reuters, Financial Times, BBC
About the Author
Arzu Alvan is an economist and financial analyst with expertise in commodity markets, monetary policy, and geopolitical risk assessment. Her research focuses on the intersection of macroeconomics, financial markets, and global governance. She writes at arzualvan.com where she publishes analysis on precious metals, digital currencies, and systemic financial dynamics.