Beyond the Surface
The recent sharp decline in gold and silver prices has left many investors questioning the “safe haven” story. I understand this reaction. When something is called a safe haven, people expect it to go up when fear goes up. But markets do not move only with fear. They move with liquidity, with interest rates, and with the simple need for cash.
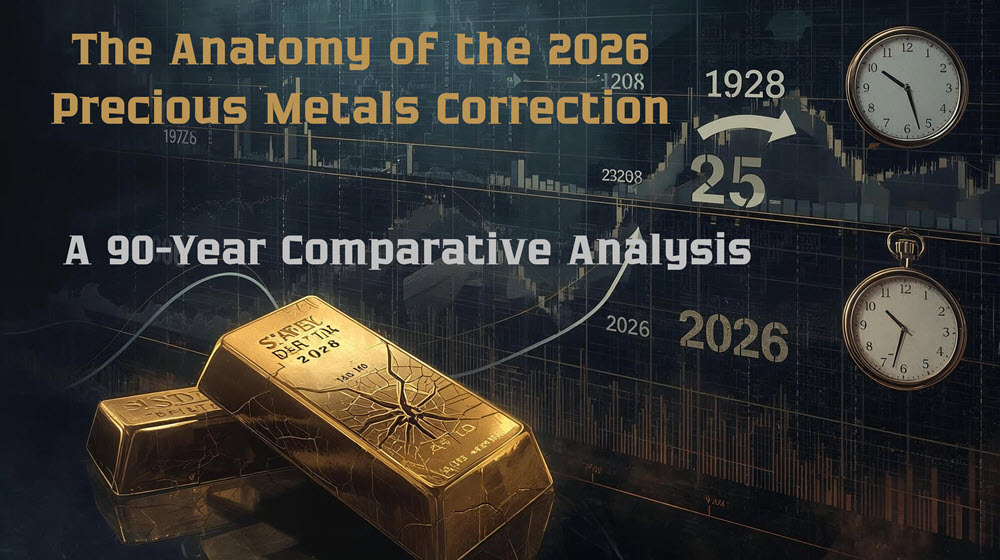
As an economist looking back at nearly a century of price behavior, I do not see the 2026 drop as an anomaly. I see a familiar sequence: a crowded trade meets a change in monetary expectations, and then the market does what it always does in stress — it looks for cash first.
In this recent move, gold fell from about $5,600 to $4,770, while silver dropped from about $117 to $77. A correction like this feels brutal, especially for investors who entered late. But the more important question is not “Why did it fall?” The better question is: “What type of correction is this — rate shock, liquidity shock, or demand shock?” The answer determines what happens next.
The Long View: 1935 to 2026 (Why Regimes Matter)
When we put 2026 on a 90-year timeline, we see that precious metals do not live in one stable universe. They live in regimes.
A regime is just a set of rules. Sometimes the rules are explicit (fixed exchange rates, convertibility, gold controls). Sometimes the rules are implicit (central bank credibility, financialization, global dollar liquidity). When the regime changes, the meaning of a gold price move changes too.
For example, the gold standard era and the Bretton Woods system were not “free markets” for gold. They were policy systems. Prices were heavily managed and the transmission channel was political. In contrast, the post-1970s world is a floating-price world, where markets re-price gold and silver quickly when real interest rates and the dollar move.
This is why a single chart without context can mislead. The point is not only the price. The point is the plumbing of the system behind the price.
Some of the words used in precious metals analysis are not friendly to everyday readers. Let me translate them into plain language.
1) Safe haven
A safe haven is an asset people buy when they are scared about the financial system. But “safe haven” does not mean “always goes up during fear.” In the first wave of panic, even safe havens can be sold if investors need cash.
2) Liquidity (and liquidity cycles)
Liquidity means: how easily you can buy or sell without moving the price too much. In good times, liquidity is abundant. In stress, liquidity disappears.
A simple example: imagine a crowded theater. When people are calm, walking is easy. When there is a fire alarm, everyone runs to the same exit. The exit is still the same size, but suddenly it is not enough. That is a liquidity event.
3) Deleveraging
Deleveraging is the process of reducing debt and leverage (borrowed money). If investors used borrowed money to buy assets, they may be forced to sell those assets when conditions tighten.
4) Margin call
A margin call is a broker telling an investor: “You must add cash or we will close your position.” During crises, margin calls create forced selling. This is one reason why silver and even gold can fall sharply at the beginning of stress.
5) Real yield
The real yield is the inflation-adjusted yield on bonds. It is not just the interest rate you see. It is roughly: nominal yield minus expected inflation.
Why does it matter? Because gold does not pay interest. If real yields rise, holding gold becomes relatively less attractive (the opportunity cost goes up). If real yields fall or become negative, gold often looks more attractive.
6) DXY
DXY is a dollar index. It is one way to track if the U.S. dollar is strengthening or weakening against a basket of major currencies. When the dollar strengthens, it often puts pressure on dollar-priced commodities, including gold and silver.
7) Opportunity cost
Opportunity cost is what you give up by choosing one asset over another. If Treasury bonds suddenly offer higher real returns, the cost of holding a non-yielding metal becomes higher.
8) Crowded trade and profit taking
A crowded trade means too many people are on the same side of the boat. When price goes up, everyone feels smart. But when the mood changes, everyone tries to exit at the same time.
Profit taking is not a moral judgment. It is simple behavior. Traders who bought earlier lock in gains when they think the upside is limited. When many do it together, it accelerates the decline.
Comparative Crisis Matrix (Peak-to-Trough Moves)
The table below is a simple map. It does not claim that every crisis is identical. It is a way to compare the mechanics: what pushed prices down, and why.
Important note: peak/trough points depend on the chosen series definition — spot vs futures, fixing vs intraday, USD vs inflation-adjusted. Always check the exact dataset used.
1980: The Rate Shock Template
The 1980 episode is a classic lesson: gold can fall not because it loses its “store of value” identity, but because policy changes the opportunity cost.
When central banks respond to inflation with aggressive tightening, real yields can rise. Higher real yields are like gravity for gold. Investors suddenly get compensated for holding paper assets again. In that world, gold’s premium can compress.
Think of it in everyday terms. If you can earn a solid real return in a safe government bond, you are less willing to hold an asset that offers no income. Gold becomes “expensive to hold” in relative terms, even if the long-run inflation story still exists.
2008: When Everything Is Sold to Raise Cash
In 2008, the world experienced a different type of shock: a balance sheet crisis.
This is where liquidity becomes the main word. In a balance sheet crisis, the immediate goal is survival. Funds, banks, and investors sell what they can — not what they want. If you are facing margin calls in equities or credit, you sell liquid positions to meet them. Precious metals are liquid.
This is why the first phase can look paradoxical. People say, “But gold is safe. Why is it falling?” The answer is simple: the market is not making a philosophical decision. It is making a cash decision.
After the first wave, the narrative can change again — especially if policy responses include large monetary expansion and lower real yields.
2011: Dollar Strength and the Real Yield Channel
The 2011 period reminds us that precious metals are global assets priced in a specific unit: the U.S. dollar.
When the dollar strengthens, commodities priced in dollars can face pressure. At the same time, if real yields rise (or are expected to rise), the opportunity cost channel comes back.
This does not mean that gold and silver stop being hedges forever. It means timing matters. A hedge is not a guarantee of daily protection. It is a long-horizon insurance — sometimes with short-horizon pain.
2020: The Dash for Cash Is a Pattern, Not a Surprise
The COVID shock in 2020 created one of the clearest examples of the dash-for-cash dynamic.
When uncertainty explodes, investors sell what they can to cover obligations and reduce risk. In that initial rush, even assets associated with safety can decline.
Then comes the second phase: policy response. When policy makers cut rates, inject liquidity, and expand balance sheets, real yields can fall. In that environment, precious metals often recover and can build a higher base.
2026: Why It Is Different (and Why It Is the Same)
Let me return to 2026.
In my previous work on silver, I described silver as a hybrid: part monetary asset, part industrial commodity. This hybrid identity is the reason silver often moves more violently than gold.
The 2026 correction has a familiar structure:
– The market became crowded. Many investors positioned for higher metals prices.
– Expectations shifted toward a more hawkish Fed. When markets anticipate tighter policy or a higher-for-longer stance, real yields and the dollar can move in a direction that is not friendly to non-yielding metals.
– Profit taking begins. When a trade is crowded, the exit door is small.
– Forced selling appears. Margin calls in other assets can force liquidation of metals positions.
I used the phrase “Warsh Effect” earlier as a shorthand for a market narrative: a sudden repricing when traders believe the Fed’s reaction function will be stricter than expected (less tolerance for inflation, more willingness to keep policy tight). Whether we like this label or not, the mechanism is clear: higher expected real yields raise the carrying cost of gold and silver.
This is why the correction feels like a liquidity vacuum. When buyers step back and sellers rush forward, prices can gap down quickly.
Data Hygiene: Before You Share a Chart, Check the Definitions
There is a technical point that protects you from making wrong conclusions (and protects the writer from embarrassment).
When someone says “gold peaked at X and fell to Y,” we must ask: which series?
– Spot price or futures continuous contract?
– London fixing, New York close, or intraday high/low?
– Nominal USD, or inflation-adjusted dollars?
These choices can change the peak and trough levels, sometimes materially. The economics of the story can still be correct, but the numbers must match the definition.
So if you are using LBMA fixings for gold, say it clearly. If you are using a long historical series for silver from a public database, name it clearly. Good research is not only about having data. It is about being transparent about what the data is.
Gold vs Silver: Same Family, Different Personality
Gold and silver are often mentioned together, but they behave differently.
Gold is closer to a monetary asset. It is held by central banks. It is used as a reserve and a credibility tool. In crisis, gold is often the first metal refuge people recognize.
Silver is smaller, thinner, and more sensitive. It has industrial demand. This industrial side makes silver more cyclical, so it can fall harder in recessions. But the smaller market size also means it can rally much faster in the second phase of a crisis when liquidity returns.
A simple way to think: gold is the adult in the room. Silver is the younger sibling — more emotional, more volatile, and sometimes more explosive in both directions.
A Practical Framework: What I Watch After a Correction
If we want a framework instead of headlines, we need a small dashboard. Here is what I watch.
1) Real yields (especially U.S. long-term real yields)
This is one of the cleanest channels to precious metals. Rising real yields usually create headwinds. Falling real yields usually create tailwinds.
2) The U.S. dollar (DXY)
Dollar strength can compress metals prices in dollar terms. Dollar weakness can support them.
3) Funding stress and short-term liquidity
When funding markets are stressed, the dash-for-cash dynamic is more likely. This is where forced selling shows up.
4) Central bank demand and long-horizon flows
Gold is not only a trader’s instrument. Central banks and long-term allocators matter, and these flows can create a floor over time.
5) The gold-silver relationship
I do not treat this as a magic signal. But it helps us understand whether the market is in fear mode (often gold leads) or reflation / liquidity return mode (often silver catches up faster).
Don’t Read One Week Like It Is One Century
My main message is simple: do not view this drop in isolation.
History shows a repeated sequence. The first phase of a crisis (or a tightening shock) is often about cash, not value. That is when precious metals can fall together with risk assets. The second phase is about policy response, real yields, and the long-run debt path. That is when metals can rebuild a floor.
As an economist, I prefer a compass over headlines. For precious metals, that compass is real yields and the dollar. If you watch these two variables, the market becomes less mysterious.
The final point is humility. Metals are not a one-direction bet. They are a mirror of the monetary system. And the monetary system, as we know, is not stable — it is a moving target.
Disclaimer
This text is for informational and educational purposes only. It is not investment advice. Markets involve risk. Data is taken from public sources as noted below, and readers should verify series definitions and dates when using the numbers for decisions.
Comparative Crisis Matrix
| Crisis Event | Gold Peak/Trough | Silver Peak/Trough | Primary Driver |
| 1980 Inflation Peak | $850 → $300 | $49 → $10 | Volcker rate hikes |
| 2008 GFC | $1,000 → $700 | $20 → $9 | Liquidity / margin calls |
| 2011 Euro crisis | $1,900 → $1,200 | $48 → $19 | USD strength / real yields |
| 2020 COVID shock | $1,700 → $1,450 | $18 → $12 | Dash for cash |
| 2026 Correction | $5,600 → $4,770 | $117 → $77 | Hawkish Fed / profit taking |
References & Data Sources
- LBMA (London Bullion Market Association) — Historical price resources: https://www.lbma.org.uk
- Federal Reserve Economic Data (FRED), St. Louis Fed — Real yields data portal: https://fred.stlouisfed.org
- World Gold Council — Research and demand trends hub: https://www.gold.org
- Alvan, A. (2025) Silver Prices and Crises: When Limited Metal Meets Unlimited Money