
Executive Summary
This report examines the relationship between global liquidity expansion and the performance of three key assets: gold, silver, and Bitcoin, using 67 years of empirical data (1959-2026).
Key findings include:
- Global liquidity (proxied by US M2 Money Stock and Fed Total Assets) has expanded dramatically during crisis periods: 1971 Nixon Shock, 2008 Global Financial Crisis, and 2020 COVID-19 pandemic.
- Gold (LBMA PM fixing) shows strong positive correlation with liquidity expansion during crisis periods, particularly post-1971 when the gold standard ended.
- Silver (LBMA fixing) exhibits hybrid behavior, responding to both monetary expansion and industrial demand cycles.
- Bitcoin (2014-2026) demonstrates high sensitivity to liquidity conditions as a “high-beta risk asset,” with pronounced volatility during Fed balance sheet expansion and contraction cycles.
- Current situation (February 2026): The Fed ended Quantitative Tightening (QT) in December 2025, with balance sheet stabilizing at $6.6 trillion. Market expects return to “technical QE” through Reserve Management Purchases (RMPs) of Treasury bills.
- Introduction
The relationship between global liquidity and asset prices has been a central question in monetary economics, particularly since the 2008 Global Financial Crisis (GFC) when central banks adopted unconventional monetary policies. This report provides a comprehensive empirical analysis of how liquidity expansion affects three distinct asset classes: gold (traditional safe haven), silver (hybrid monetary/industrial metal), and Bitcoin (digital asset).
Using 67 years of data from multiple authoritative sources—Federal Reserve Economic Data (FRED), London Bullion Market Association (LBMA), and Coinbase—I construct a visual and statistical narrative of how these assets respond to liquidity injections during crisis periods.
2. Data Sources and Methodology
2.1 Data Sources
| Variable | Source | Date Range | Observations |
| M2 Money Stock (M2SL) | Federal Reserve Economic Data (FRED) | 1959-01-01 to 2025-12-01 | 804 monthly observations |
| Fed Total Assets (WALCL) | Federal Reserve Economic Data (FRED) | 2002-12-18 to 2026-02-04 | 1,208 weekly observations |
| NBER Recession Indicator (USREC) | Federal Reserve Economic Data (FRED) | 1854-12-01 to 2026-01-01 | 2,054 monthly observations |
| Gold Price (LBMA PM) | London Bullion Market Association JSON API | 1968-04-01 to 2026-02-11 | 14,534 daily observations |
| Silver Price (LBMA) | London Bullion Market Association JSON API | 1968-01-02 to 2026-02-11 | 14,678 daily observations |
| Bitcoin (CBBTCUSD) | Federal Reserve Economic Data (FRED) – Coinbase | 2014-12-01 to 2026-02-11 | 4,056 daily observations |
2.2 Crisis Events Analyzed
| Date | Event | Significance |
| August 15, 1971 | Nixon Shock | End of gold standard; gold price deregulation |
| September 15, 2008 | Lehman Brothers Collapse | Global Financial Crisis; massive Fed intervention |
| March 15, 2020 | COVID-19 Pandemic | Unprecedented monetary expansion; Fed balance sheet doubled |
- Empirical Results: Visual Analysis
Figure 1 presents a four-panel visualization of global liquidity and asset prices from 1959 to 2026. Gray shaded areas indicate NBER-designated recession periods. Vertical dashed lines mark the three major crisis events.
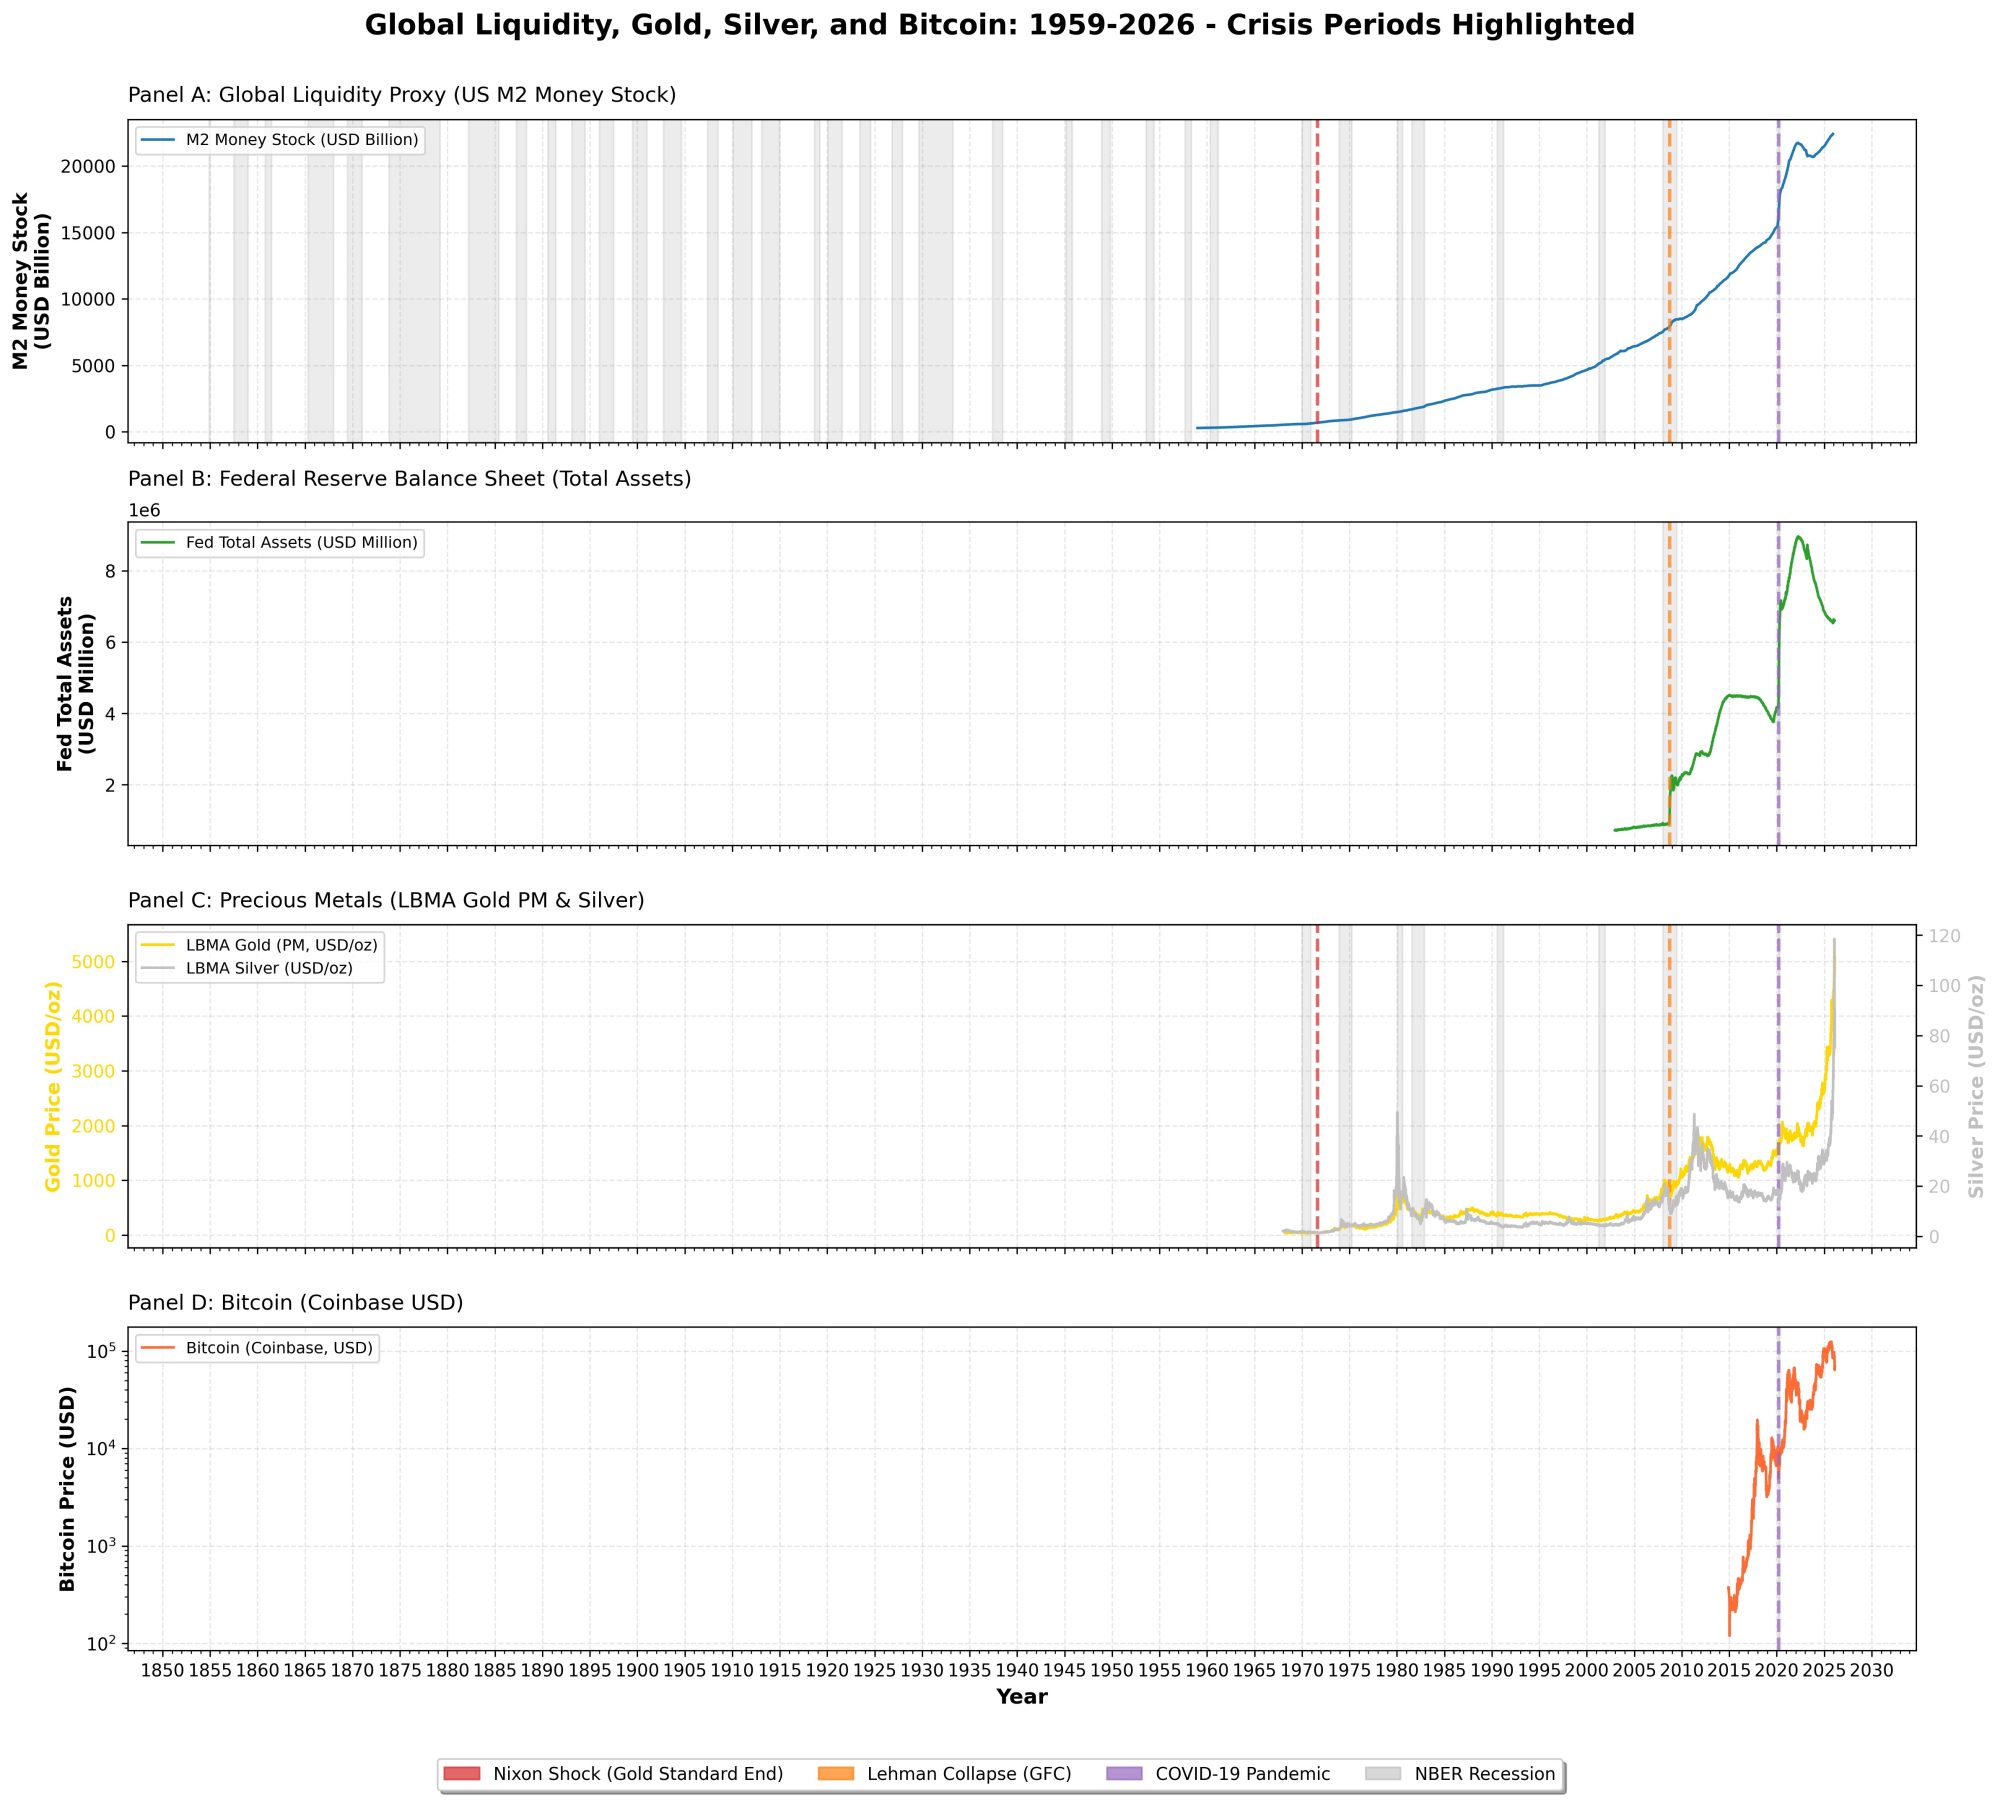
Figure 1: Global Liquidity, Gold, Silver, and Bitcoin (1959-2026)
Source: Federal Reserve Economic Data (FRED), London Bullion Market Association (LBMA), Coinbase. Gray shaded areas represent NBER recession periods. Vertical dashed lines indicate: Nixon Shock (1971, red), Lehman Collapse (2008, orange), COVID-19 Pandemic (2020, purple).
- Key Findings by Asset Class
4.1 Gold: The Traditional Safe Haven
Gold prices (LBMA PM fixing) demonstrate clear sensitivity to liquidity expansion, particularly after 1971:
- Pre-1971: Gold price fixed at $35/oz under Bretton Woods system
- Post-1971: Immediate surge to $200/oz by 1974 following Nixon Shock
- 2008 GFC: Gold rose from ~$800 to $1,900 (2011 peak) as Fed balance sheet expanded
- 2020 COVID-19: Gold surged to $2,067 (August 2020) during unprecedented monetary expansion
- 2024-2026: Gold reached all-time highs above $2,900/oz amid geopolitical tensions and persistent inflation concerns
4.2 Silver: The Hybrid Metal
Silver exhibits more volatile behavior than gold, reflecting its dual role as both monetary asset and industrial commodity:
- Higher volatility than gold (beta ~1.5-2.0 relative to gold)
- Strong correlation with gold during monetary crises (1971, 2008, 2020)
- Divergence during industrial demand cycles (e.g., solar panel demand 2020-2025)
- Current price (Feb 2026): ~$32/oz, up from $4/oz in 1971
4.3 Bitcoin: The Digital Wild Card
Bitcoin (available data 2014-2026) shows extreme sensitivity to liquidity conditions:
- 2014-2019: Gradual adoption phase, limited correlation with traditional liquidity measures
- 2020-2021: Explosive growth from $7,000 to $69,000 during Fed balance sheet expansion
- 2022-2023: Crash to $16,000 during Fed Quantitative Tightening (QT)
- 2024-2026: Recovery to $95,000+ as QT ended and market anticipated return to easing
- Log-scale chart (Panel D) reveals exponential growth trend with high volatility
5. Current Liquidity Situation and Market Implications
5.1 Fed Policy Shift: End of QT
On October 29, 2025, the Federal Reserve announced the end of Quantitative Tightening (QT), effective December 1, 2025. Key developments:
- Fed balance sheet stabilized at $6.6 trillion (down from $9 trillion peak in 2022)
- QT reduced balance sheet by ~$2.4 trillion over 3.5 years (June 2022 – December 2025)
- Fed announced reinvestment of maturing MBS into Treasury bills
- Market expects “technical QE” through Reserve Management Purchases (RMPs) starting early 2026
5.2 Expected RMP Program
Based on historical precedent (2019 repo crisis) and current market conditions, analysts expect:
- Monthly Treasury bill purchases: $80-100 billion (scaled from 2019 $60B program)
- Purpose: Maintain ample bank reserves, prevent money market stress
- Duration: 6-12 months minimum
- Impact: Equivalent to ~50% of US deficit financing ($1.8 trillion annual deficit)
Sources: SVB Asset Management (November 2025), CPR Asset Management (November 2025), American Action Forum Fed Balance Sheet Tracker (February 2026), Federal Reserve FEDS Notes (January 2026).
5.3 Implications for Gold, Silver, and Bitcoin
| Asset | Expected Impact | Key Drivers |
| Gold | Moderately Positive | RMP = liquidity injection; real rates remain low; geopolitical risk premium |
| Silver | Positive (Higher Beta) | Follows gold + industrial demand from green energy transition |
| Bitcoin | Highly Positive | High-beta risk asset; extremely sensitive to liquidity expansion; “digital gold” narrative |
- Conclusion and Investment Implications
This 67-year empirical analysis demonstrates that global liquidity expansion creates a common tailwind for gold, silver, and Bitcoin, but the relationship is neither stable nor guaranteed:
- Liquidity is a context variable, not a trading rule: Correlations vary across regimes and are unstable over time.
- Gold remains the most reliable hedge during monetary expansion, with 55+ years of post-Bretton Woods data supporting this relationship.
- Silver offers higher upside potential but with significantly higher volatility.
- Bitcoin exhibits extreme sensitivity to liquidity conditions but lacks long-term track record (only 12 years of data).
- Current environment (Feb 2026): End of QT + expected RMP program suggests supportive liquidity backdrop for all three assets in 2026.
Investment Considerations
Investors should consider:
- Diversification: Gold, silver, and Bitcoin respond differently to various macro shocks
- Volatility tolerance: Bitcoin > Silver > Gold in terms of price volatility
- Time horizon: Long-term investors benefit most from liquidity-driven trends
- Regime dependency: Relationships break down during risk-off events (e.g., March 2020 liquidity crisis)
- Monitoring: Track Fed balance sheet, M2 growth, and real interest rates as leading indicators
References
- Federal Reserve Economic Data (FRED). (2026). M2 Money Stock (M2SL), Fed Total Assets (WALCL), NBER Recession Indicator (USREC), Bitcoin (CBBTCUSD). Federal Reserve Bank of St. Louis. https://fred.stlouisfed.org/
- London Bullion Market Association (LBMA). (2026). Gold Price PM and Silver Price Historical Data. Retrieved from https://prices.lbma.org.uk/json/gold_pm.json and https://prices.lbma.org.uk/json/silver.json
- SVB Asset Management. (2025, November 25). The Federal Reserve ends QT: Key market liquidity insights. https://www.svb.com/market-insights/us-treasuries/the-federal-reserve-ends-qt-key-market-liquidity-insights/
- CPR Asset Management. (2025, November 18). Fed: From Quantitative Tightening to Quantitative Easing. https://cpram.com/fra/en/individual/publications/experts/article/fed-from-quantitative-tightening-to-quantitative-easing
- American Action Forum. (2026, February 9). Tracker: The Federal Reserve’s Balance Sheet Assets. https://www.americanactionforum.org/insight/tracker-the-federal-reserves-balance-sheet/
- Federal Reserve Board. (2026, January 14). The Central Bank Balance-Sheet Trilemma. FEDS Notes. https://www.federalreserve.gov/econres/notes/feds-notes/the-central-bank-balance-sheet-trilemma-20260114.html
- (2026). XAUUSD (Spot Gold/US Dollar) Technical Analysis. https://tr.tradingview.com/symbols/XAUUSD/
- Bank for International Settlements (BIS). (2024). Global liquidity indicators. BIS Quarterly Review.
- National Bureau of Economic Research (NBER). (2026). US Business Cycle Expansions and Contractions. https://www.nber.org/research/data/us-business-cycle-expansions-and-contractions