Introduction
Sometimes the global economy feels like a neighborhood where the same house keeps catching fire. We put out the flames, we rebuild, and then we move on—only to watch the embers ignite somewhere else entirely. Over the past sixty years, the world has witnessed oil shocks, financial meltdowns, pandemics, and now, a potential crisis brewing in a corner of the commodities market that most people rarely think about: silver.
This article examines two seemingly distinct phenomena. First, we analyze six decades of full-time employment data from the United States Federal Reserve Economic Data (FRED) system, tracing the relationship between labor markets and major global crises. Second, we turn our attention to the COMEX silver market, where an unprecedented imbalance between paper claims and physical inventory is threatening to erupt into a full-blown delivery crisis in March 2026. The connection between these two subjects is not immediately obvious, but it exists: both stories are fundamentally about the gap between what the numbers say and what reality delivers.
Part I: The Labor Market as a Mirror of Crisis
Understanding the Data
When economists speak of employment as a “lagging indicator,” what they mean is that the labor market reacts slowly. The economy may begin to contract, but employers do not immediately lay off workers. They wait. They hope. They defer the painful decision. And when the economy begins to recover, they are equally cautious about hiring.
The FRED full-time employment series provides a window into this phenomenon. By examining the year-over-year (YoY) percentage change in full-time employment—that is, comparing each month to the same month one year earlier—we can identify the precise moments when crises translated into job losses. The pattern is consistent: economic shocks lead to employment contractions, but the depth and duration of those contractions vary enormously depending on the nature of the crisis.
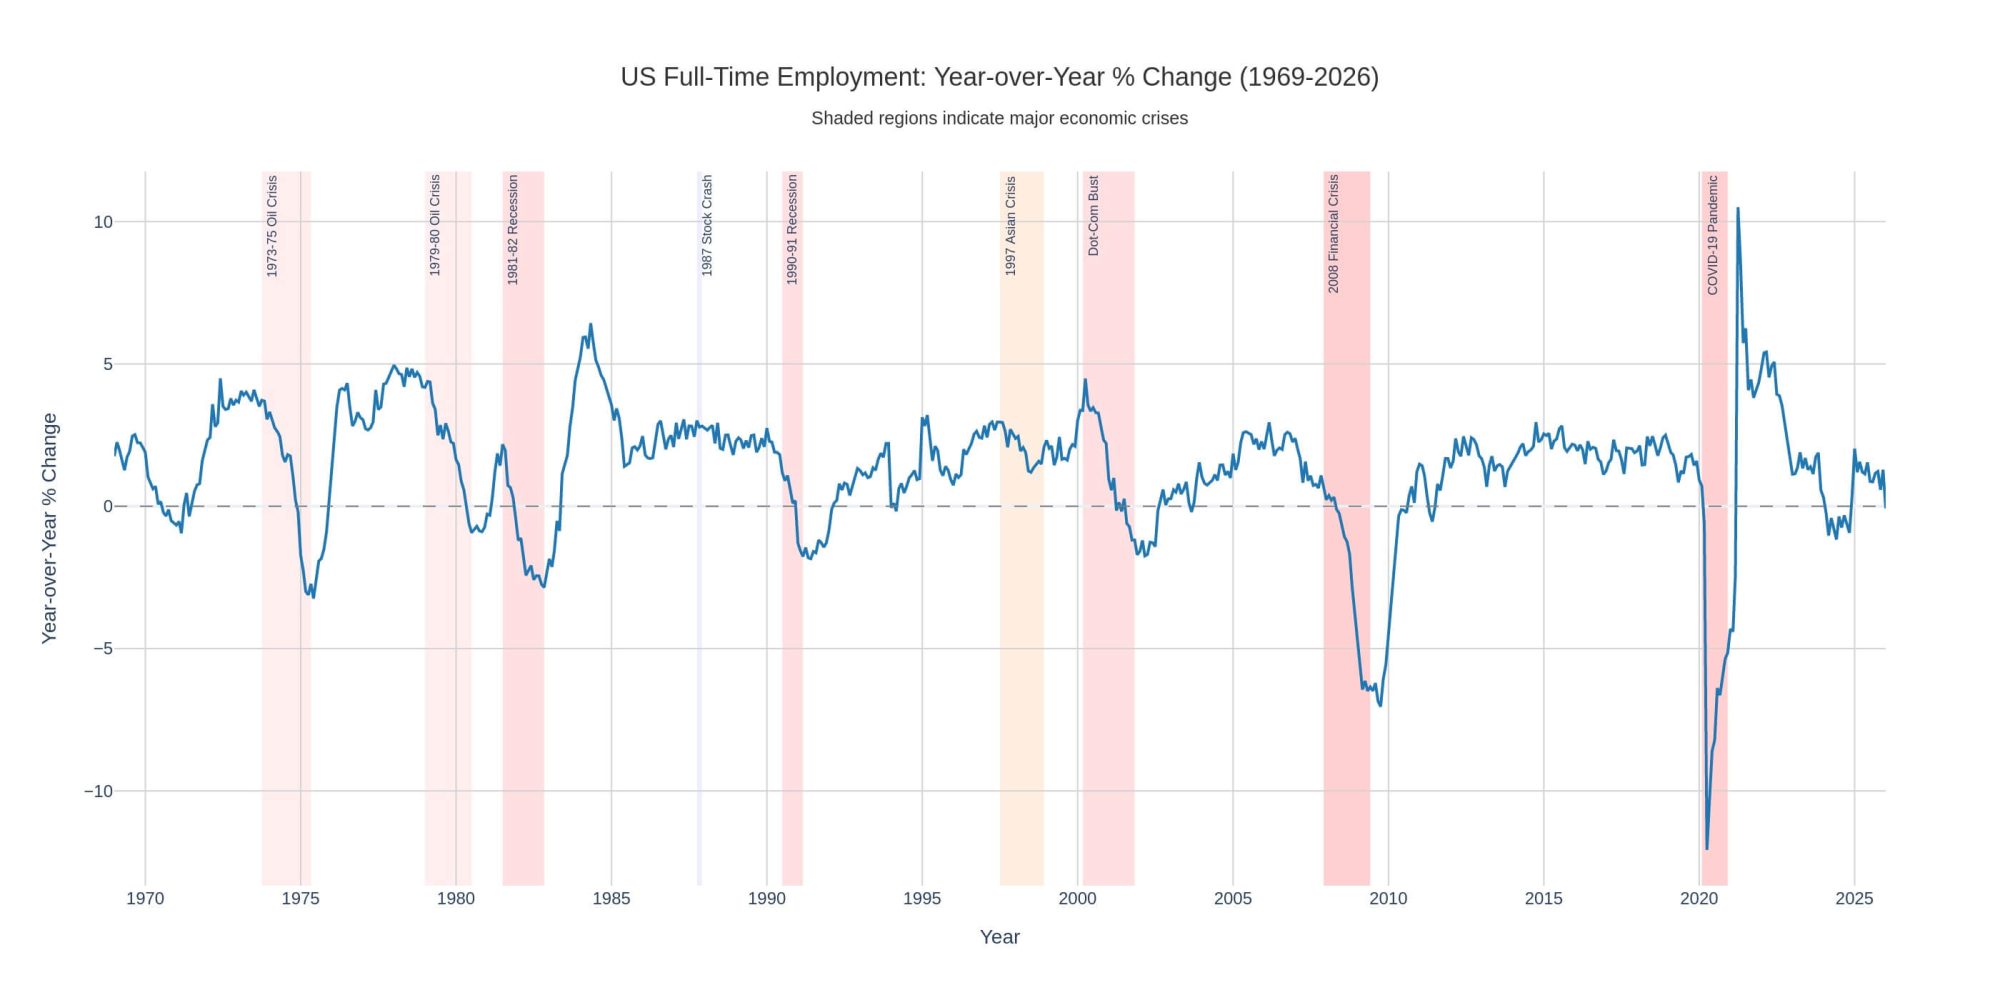
Figure 1: U.S. Full-Time Employment Year-over-Year Change with Crisis Periods (1968-2026)
The 1970s: When Oil Became a Weapon
The oil crises of the 1970s introduced the world to a new economic phenomenon: stagflation. This is the toxic combination of high inflation and stagnant growth, a condition that classical economic theory had deemed impossible. The 1973 oil embargo by OPEC quadrupled the price of oil virtually overnight. The 1979 crisis, triggered by the Iranian Revolution, delivered a second blow before the economy had fully recovered from the first.
The employment data tells the story vividly. U.S. full-time employment growth, which had been running at over 4% in mid-1973, began a steady decline. By June 1975, it had collapsed to -3.2%. Think about what this means: for every 100 workers employed full-time in June 1974, only 97 remained one year later. Millions of jobs vanished.
These were not simply cyclical downturns. They represented a structural shift. Manufacturing, the backbone of the American middle class, never fully recovered its previous trajectory. The service sector expanded to fill the gap, but often at lower wages and with fewer protections.
The Early 1980s: Policy as Pain
The recession of 1981-82 was, in a sense, deliberately engineered. Paul Volcker, chairman of the Federal Reserve, raised interest rates to unprecedented levels—the prime rate reached 21.5%—to break the back of inflation. He succeeded, but at an enormous cost.
Employment contracted for nearly two years. At its worst, in late 1982, full-time employment was shrinking at a rate of -2.85% year-over-year. The national unemployment rate peaked at 10.8%, the highest since the Great Depression. Yet the subsequent recovery was equally dramatic. By early 1984, employment growth had surged past 5%, demonstrating that a sharp, policy-induced downturn could be followed by an equally sharp rebound.
The 1987 Crash: The Crisis That Wasn’t
October 19, 1987—Black Monday—saw the Dow Jones Industrial Average fall by 22.6% in a single day. It remains the largest one-day percentage decline in history. Fear of another Great Depression was widespread.
And yet, nothing happened to the broader economy. Employment growth continued serenely at 2-3% throughout 1987 and 1988. How is this possible?
The answer lies in the speed and decisiveness of the Federal Reserve’s response. Within hours of the crash, the Fed announced that it would provide unlimited liquidity to the financial system. Banks would not fail. Credit would not freeze. The contagion was contained.
This episode offers an important lesson: a financial market crisis does not automatically become an employment crisis. The link can be severed by appropriate policy intervention. Unfortunately, this lesson was forgotten twenty years later.
2008: When Everything Connected
The Global Financial Crisis of 2008 was different from everything that came before. It was not a supply shock like the oil crises. It was not a contained market panic like 1987. It was a systemic failure of the global financial architecture, originating in the arcane world of subprime mortgages and spreading through channels that few regulators had even thought to monitor.
The employment collapse was catastrophic. U.S. full-time employment fell by 7.0% year-over-year at its worst point in October 2009. This was nearly twice as severe as the 1982 recession. The global synchronization was equally striking: employment contracted worldwide, with global YoY growth falling to -1.03% in 2009.
The recovery was agonizingly slow. Unlike the sharp V-shaped rebound of 1983-84, the post-2008 period was characterized by a “jobless recovery”—a term that had first emerged after the 1991 recession but now took on new meaning. It took years for employment to return to pre-crisis levels.
2020: The Pandemic as Economic Event
And then came COVID-19. This was not a financial crisis or a supply shock. It was an exogenous shock—a public health emergency that governments responded to by deliberately shutting down vast sectors of the economy.
The employment collapse was unlike anything in modern history. In April 2020, U.S. full-time employment was down 12.1% year-over-year. More than 20 million jobs vanished in a single month. The global contraction reached -3.37% in 2020, far exceeding even the GFC.
The recovery, driven by unprecedented fiscal stimulus and vaccine rollouts, was equally dramatic. By April 2021, employment was growing at over 10% year-over-year—a base effect, certainly, but also a reflection of the economy’s remarkable capacity to rebound when the cause of the shutdown was removed.
Part II: The Silver Market’s Gathering Storm
We turn now from the labor market to a different arena: the commodities exchange. Specifically, we examine the COMEX silver market and the brewing crisis surrounding the March 2026 delivery period.
To understand what is happening, you must first understand how commodities trading works. When you buy a silver futures contract on COMEX, you are not buying physical silver. You are buying a promise—a piece of paper that says someone will deliver silver to you at a specified future date. Most traders never intend to take delivery. They close their positions before the delivery date, profiting from price movements. The physical silver sitting in the exchange’s warehouses is rarely touched.
This system works beautifully as long as everyone plays by the same rules. But what happens when traders actually want the physical metal?
The Inventory Problem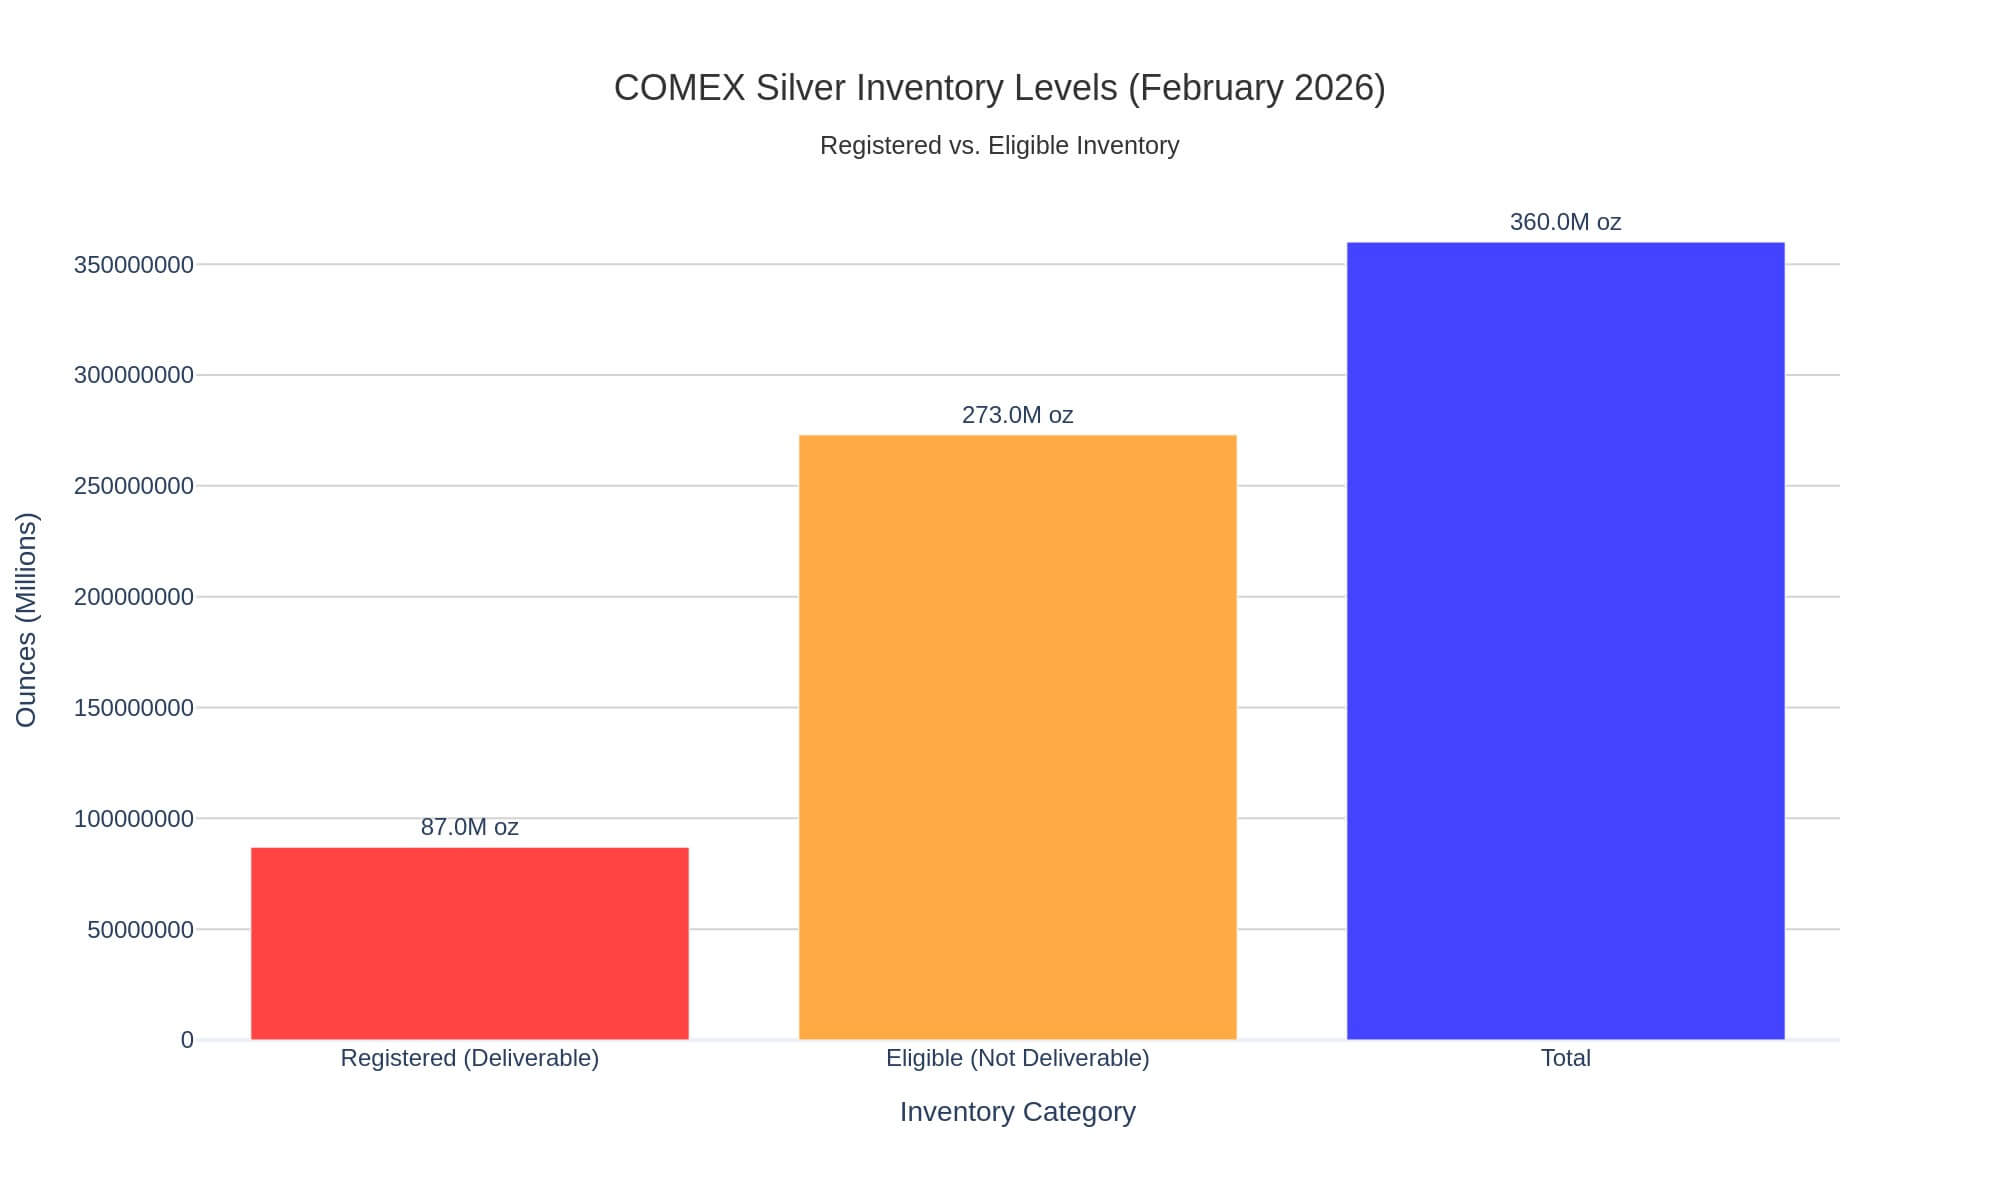
Figure 3: COMEX Silver Inventory Levels and Open Interest
COMEX maintains two categories of silver inventory. “Registered” silver is metal that has been designated for delivery—it is available to fulfill futures contracts. “Eligible” silver is simply stored at COMEX-approved warehouses but has not been made available for delivery. The distinction matters enormously.
As of late February 2026, registered silver inventory has fallen to approximately 86-88 million ounces. Total inventory (registered plus eligible) stands at around 360-366 million ounces, a decline of over 30% since October 2025.
Now consider the other side of the equation: open interest. For the March 2026 contract, open interest has been reported in a range from 429 million ounces to as high as 528 million ounces. This means that for every ounce of silver registered for delivery, there are at least four to six ounces of paper claims outstanding.
This is leverage. This is a mismatch. And in March 2026, this is a problem.
The January Warning
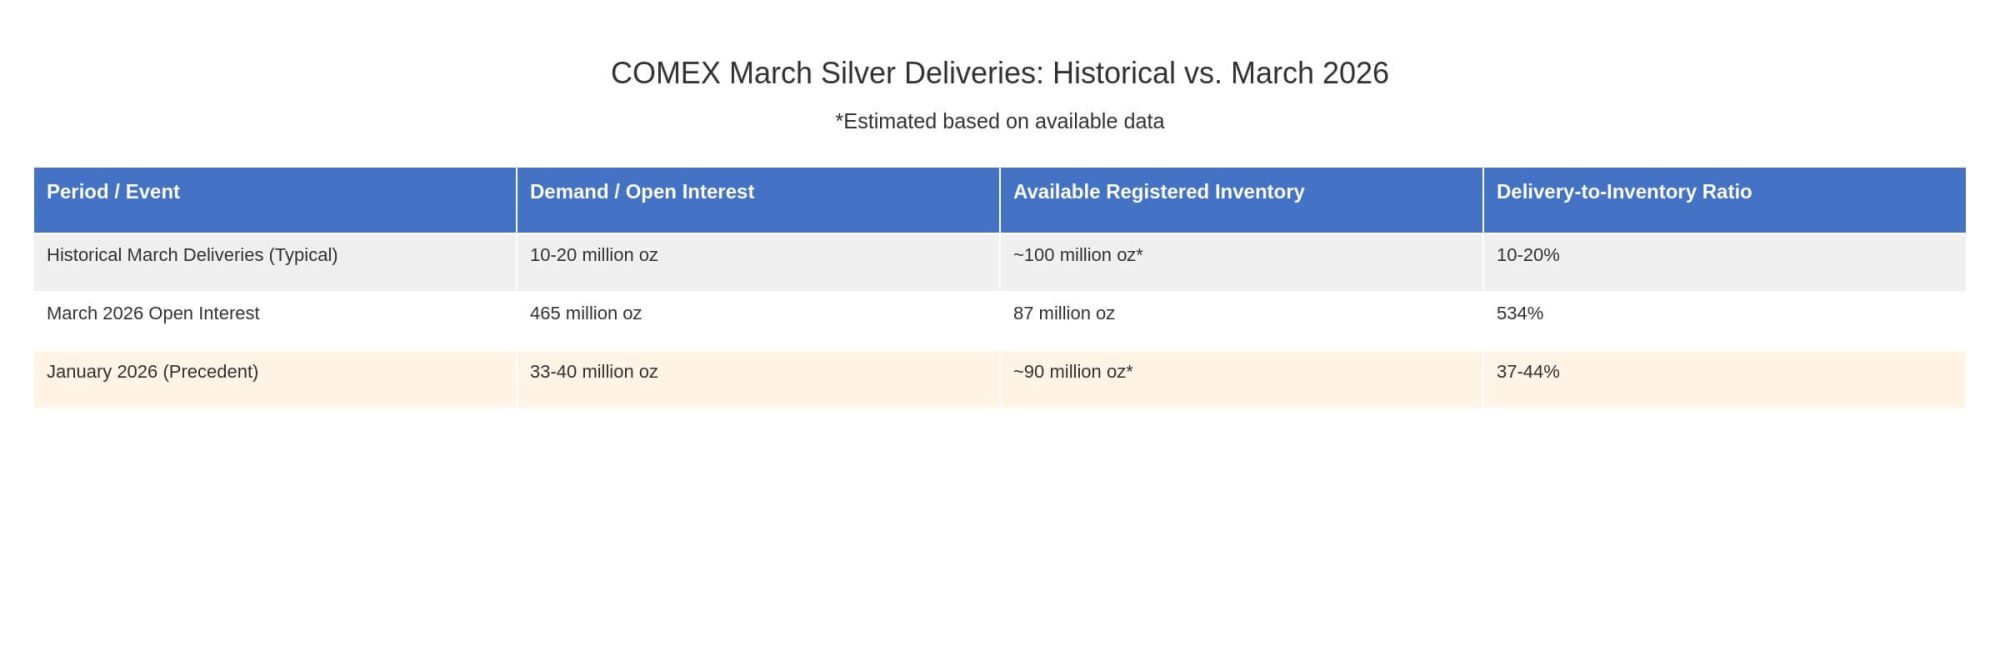
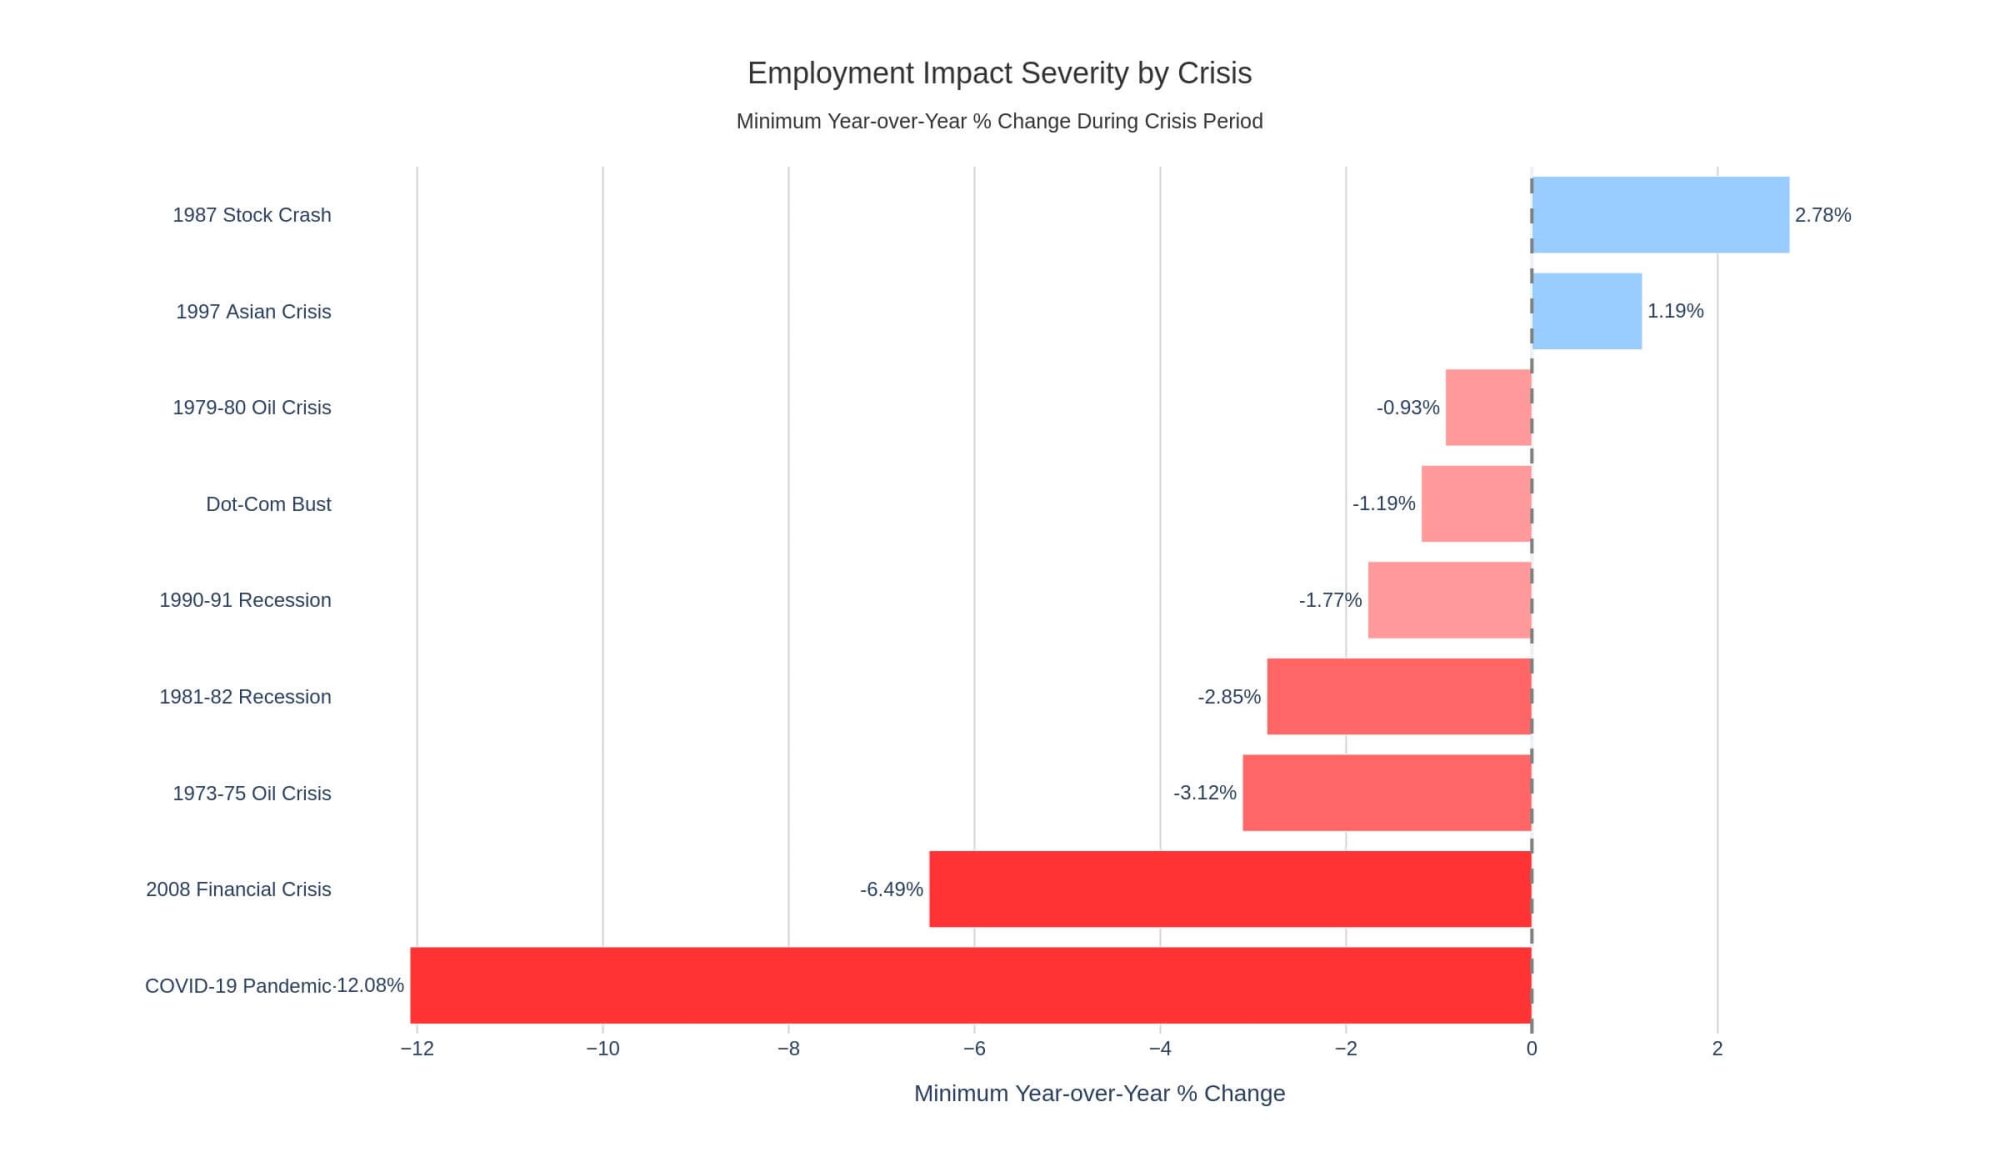
Figure 4: Historical vs. Current Delivery Demands
January is not a major delivery month for silver. Historically, January deliveries have ranged between 1 and 5 million ounces—a fraction of what occurs in March, which is a major delivery month.
In January 2026, delivery demand surged to 33-40 million ounces. This is seven to ten times the historical average.
What does this mean? Market participants are not waiting for March. They are front-running. They are taking delivery early because they do not trust that the silver will be there when the March contracts come due. This behavior is self-reinforcing: the more people who take early delivery, the less inventory remains, the more nervous the remaining contract holders become, and the more likely they are to demand early delivery as well.
The January surge is not a random fluctuation. It is a signal. The market is losing faith.
The March 7, 2026 Delivery Date
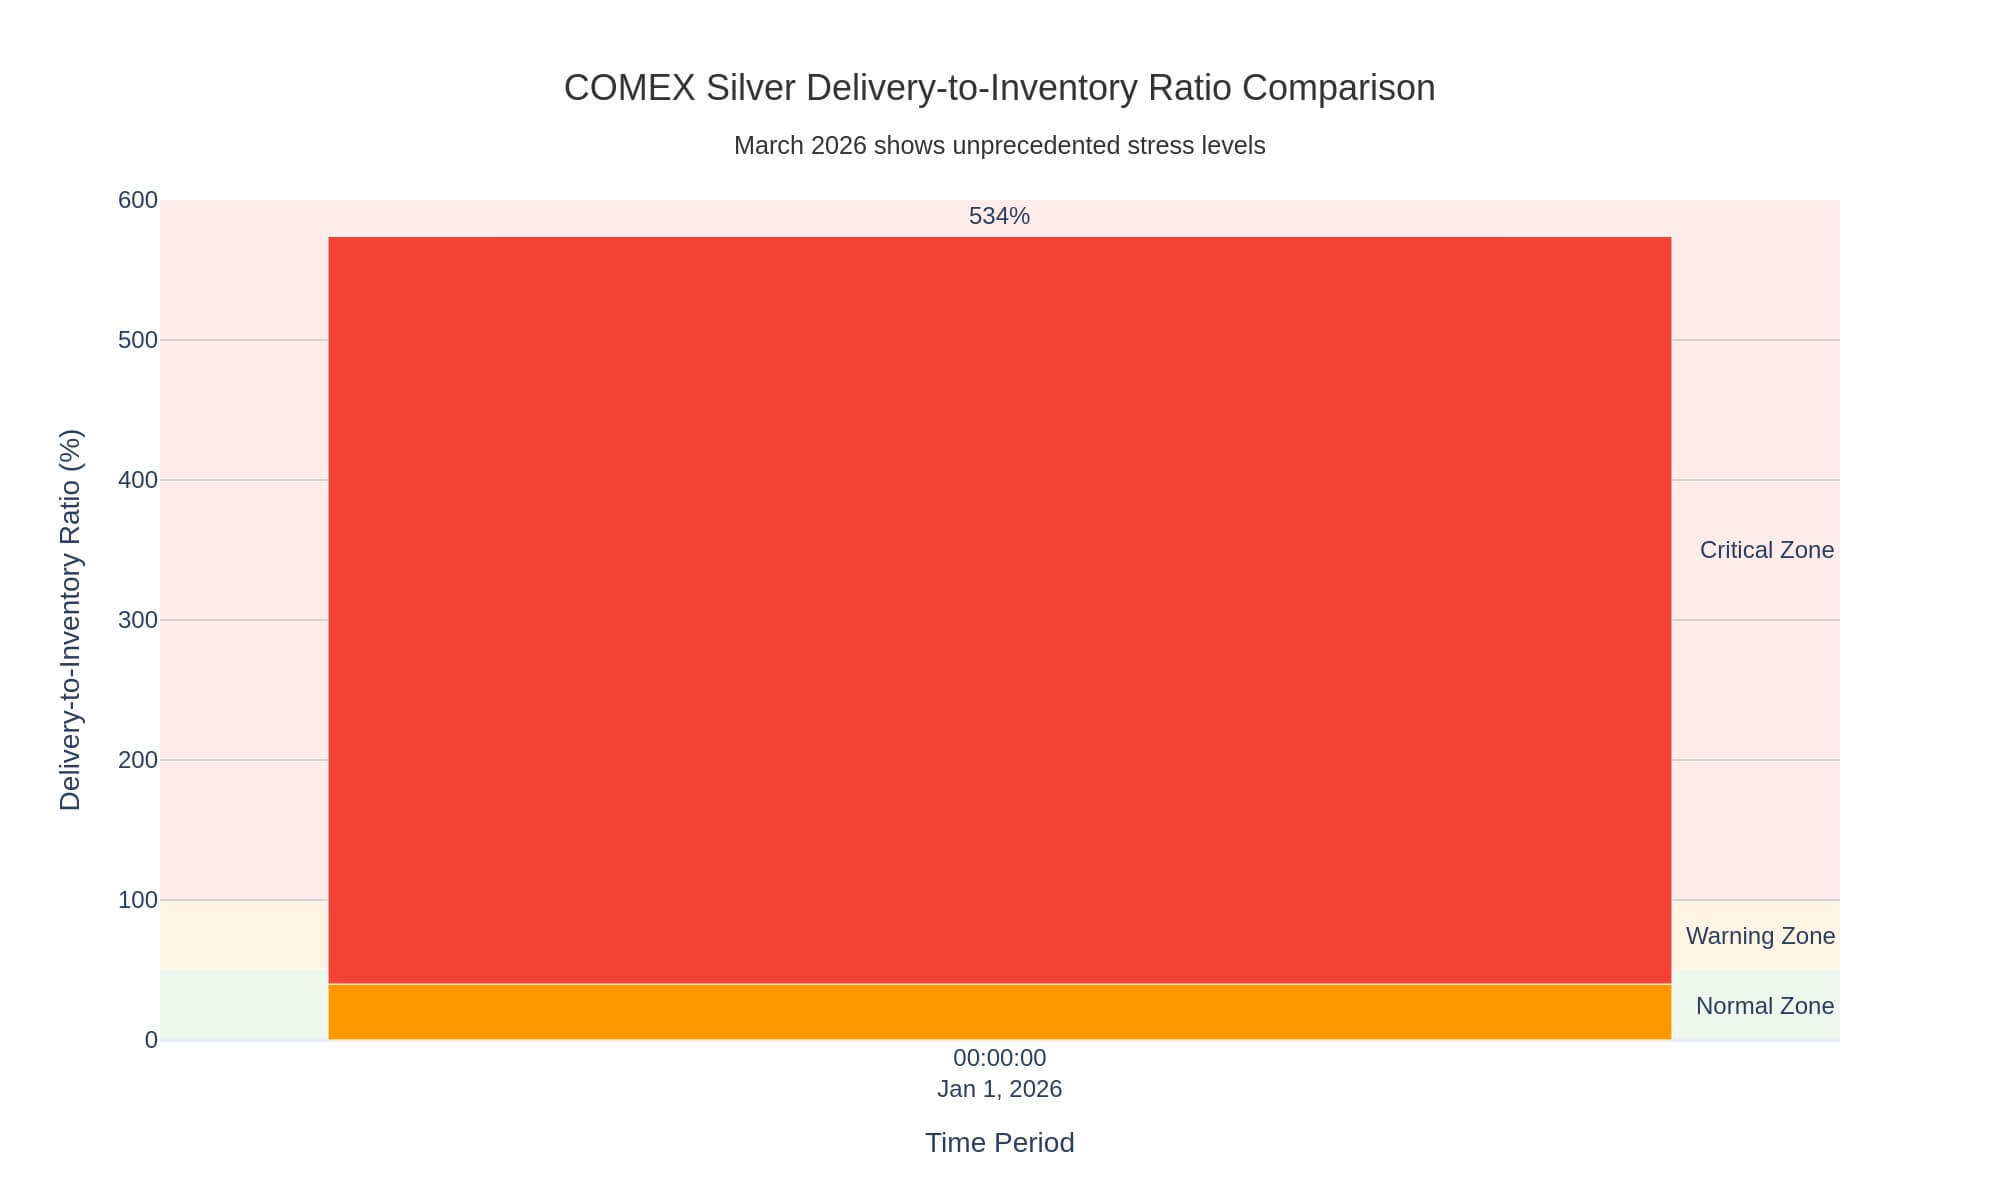
Figure 5: Open Interest to Registered Inventory Ratio
March 7, 2026, is the first delivery date for the March silver contract. What happens on and after that date will determine whether the COMEX silver market experiences an orderly resolution or a historic crisis.
Several scenarios are possible:
1. **Managed Resolution with Volatility:** COMEX may use its regulatory tools aggressively. Margin requirements could be raised to prohibitive levels, discouraging speculative positions. The exchange could offer cash settlement premiums to traders willing to close their positions rather than demand physical delivery. Eligible inventory could be converted to registered status. Under this scenario, prices might spike to $120-150 per ounce, but the system would hold.
2. **Severe Strain:** If physical demand exceeds available supply despite the exchange’s efforts, we could see partial defaults—some contracts being force-settled in cash rather than in metal. This would shatter confidence in the paper silver market and likely create a divergence between paper prices and physical prices. Prices could reach $150-180 per ounce or higher.
3. **Market Intervention:** In the most extreme scenario, regulators could step in to suspend trading or impose emergency rules. This has happened before in other markets—notably during the Hunt Brothers silver squeeze of 1980—and it remains a possibility today.
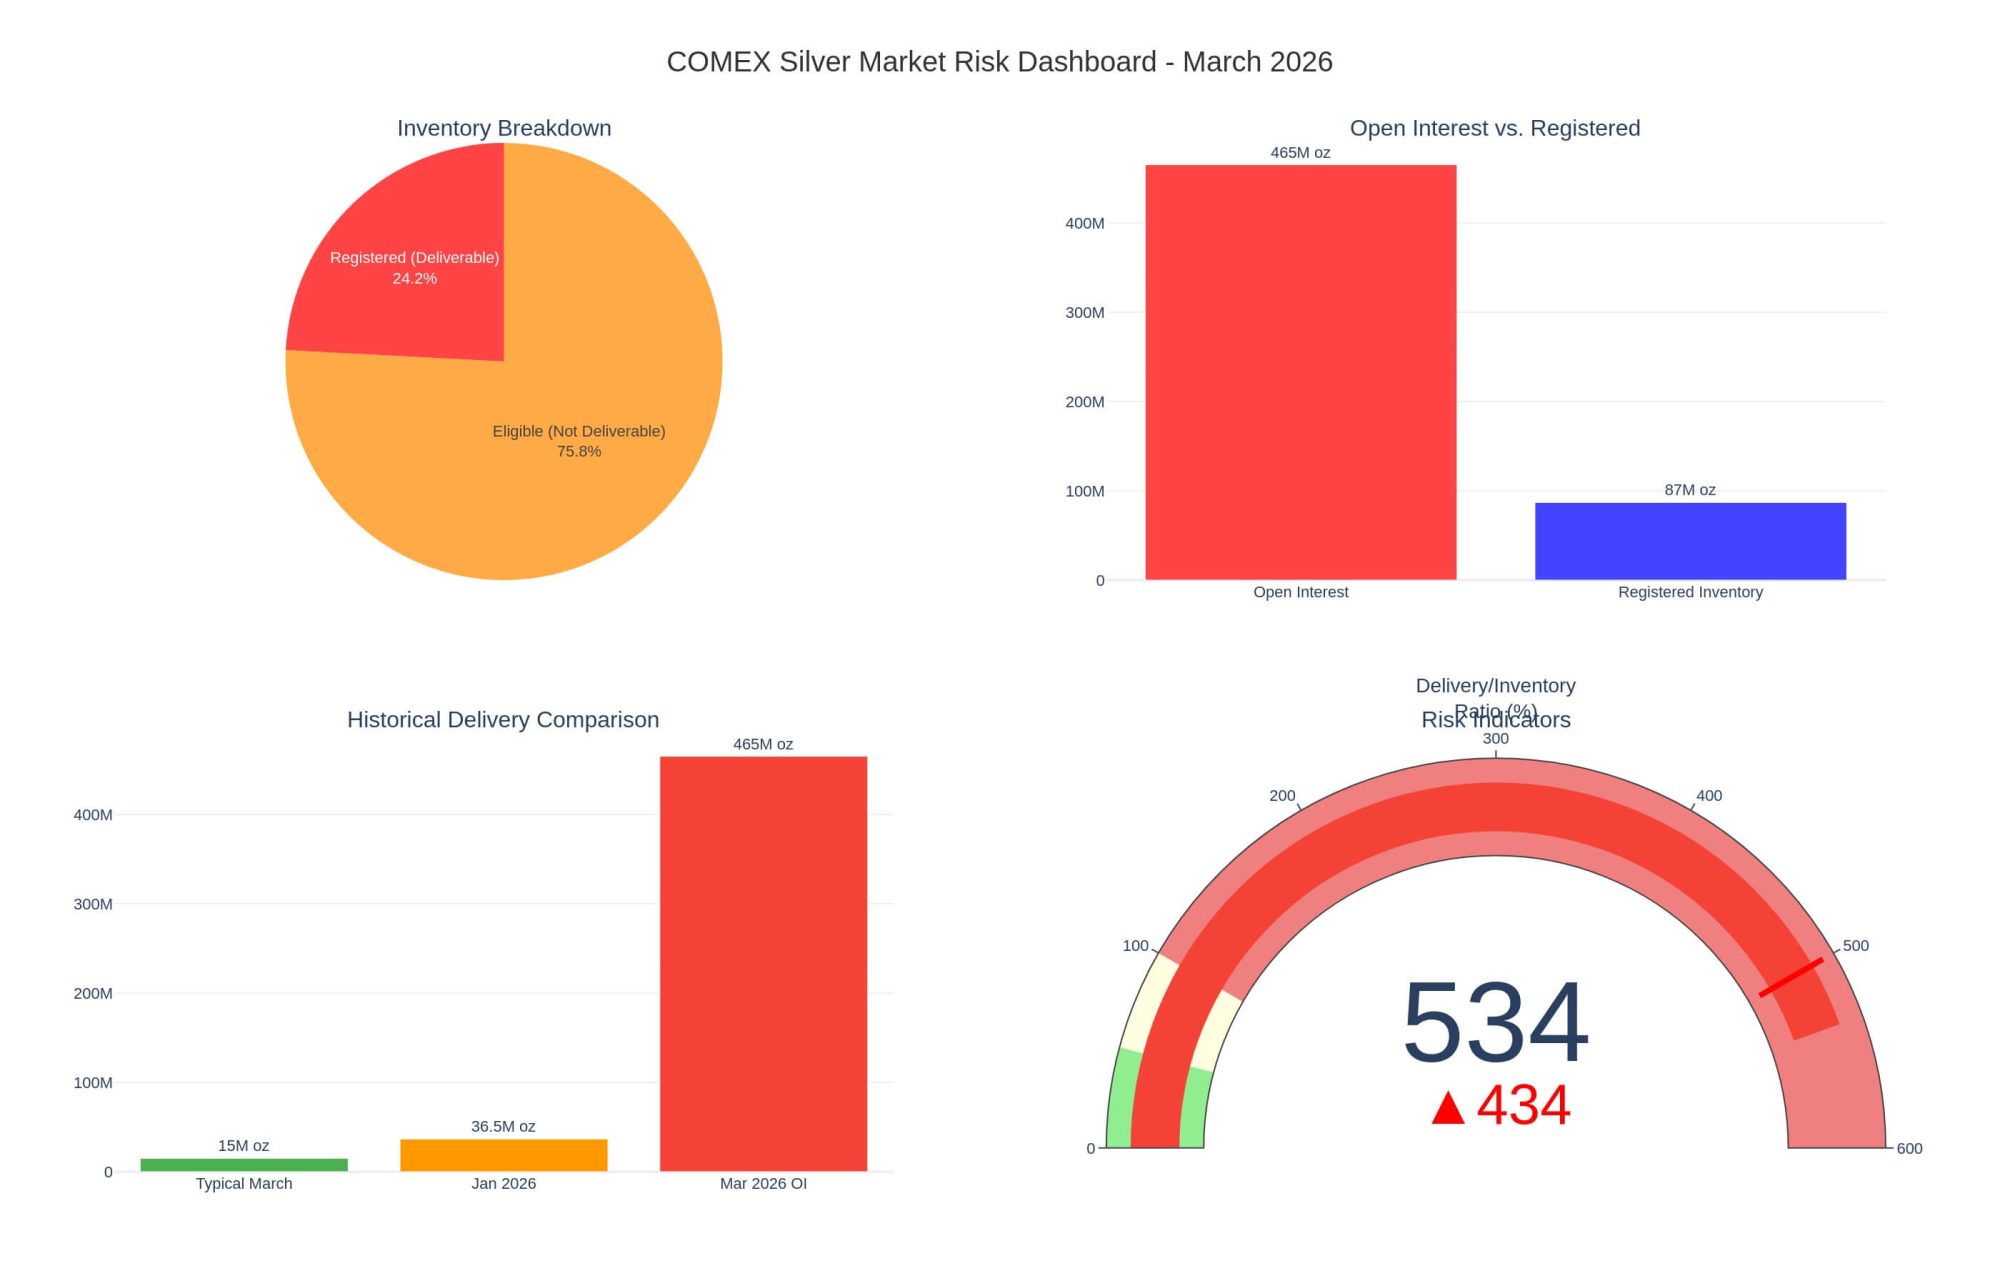
Figure 6: Silver Market Dashboard – Key Metrics for March 2026
Why This Matters Beyond Silver
Some readers may wonder why a potential crisis in the silver market warrants concern. After all, silver is a relatively small market compared to bonds, equities, or even other commodities like oil.
The answer lies in what a silver delivery failure would reveal about the broader financial system. Commodities markets are built on trust—trust that the metal will be there, trust that the counterparty will perform, trust that the exchange will enforce its rules fairly. A breakdown in this trust would raise uncomfortable questions about other markets. If COMEX cannot deliver the silver it has promised, what other paper promises might prove to be hollow?
Moreover, silver is experiencing a surge in industrial demand. It is essential for solar panels, electronics, and medical devices. A price spike or supply disruption would ripple through these industries, potentially affecting the green energy transition that governments worldwide have staked their climate policies upon.
Conclusion: Lessons from History and Warnings for the Future
The employment data of the past sixty years teaches us that crises are inevitable, but their impacts are not predetermined. Policy responses matter. The speed and decisiveness of intervention can mean the difference between a contained financial panic (1987) and a generational economic catastrophe (2008). The structure of the crisis matters too: supply shocks create different patterns than financial collapses, and exogenous shocks like pandemics can produce unprecedented V-shaped disruptions.
The silver market in early 2026 is exhibiting the classic symptoms of stress: falling inventories, rising claims, eroding confidence, and early delivery demand that suggests participants no longer trust the system to function as designed. Whether this resolves in an orderly fashion or erupts into a historic squeeze depends on decisions that will be made in the coming weeks.
What connects these two stories—employment and silver—is the fundamental fragility of systems built on confidence. Labor markets depend on employers’ confidence that demand will persist. Commodities markets depend on traders’ confidence that physical metal backs the paper promises. When that confidence erodes, the consequences can be swift and severe.
We have been here before. The question is whether we have learned anything from the experience.
References
[1] Federal Reserve Economic Data (FRED), Full-Time Employment Series, Federal Reserve Bank of St. Louis
[2] COMEX Silver Futures Historical Data, CME Group
[3] “The Inventory Trap: Why Silver’s Crash is Coming,” Substack Analysis, 2026
[4] “2026 Silver Run: When the Paper Game Collapses,” TradingKey Analysis
[5] “COMEX Silver Default Risk: Inventory Crisis 2026,” Discovery Alert
[6] Federal Reserve History: Oil Shock of 1973-74, Recession of 1981-82, Stock Market Crash of 1987
[7] Bureau of Labor Statistics: Historical Employment Reports
[8] World Bank Employment Data and Global Economic Prospects Reports
[9] Investopedia: 1973 Oil Crisis, Stock Market Crash of 1987
[10] Pew Research Center: “A Brief History of Employment Trends in Recessions and Recoveries”
About the Analysis: This article was produced as part of an ongoing effort to make rigorous economic and market analysis accessible to non-specialist audiences. The analysis sits at the intersection of macroeconomic history, labor market dynamics, and commodities market structure. All data sources are publicly available and cited for reference.