Something strange happens with silver when the world gets into trouble. The price moves up before
the crisis becomes official news. It is like silver knows something we don’t yet see.
This is not a conspiracy theory. This is just looking at the data from the last fifty years. Silver moved up
before the 1970s inflation disaster. It moved up before the 2008 financial crisis. It moved up before the
pandemic shock in 2020.
Could this be a warning signal that we should pay attention to?
The Basic Question: Limited vs Unlimited
I have talked about this in earlier writings. There are two types of money in the world.
Limited money: Gold and silver. You cannot create more just by having a meeting or signing a paper.
The supply is physically limited by nature.
Unlimited money: Fiat currencies, government bonds, and all the debt built on top of them. These
can expand very quickly when central banks and governments decide to print more.
When debt grows faster than the real economy, people start asking a simple question: “Are these
paper promises really safe?”
Silver prices, measured in those same paper currencies, give us one answer to this question. That is
why the connection between silver and crises is not just coincidence.
Source: Macrotrends – Historical Silver Prices, SilverPrice.org
The 1970s: The First Big Warning
In the mid-1970s, silver was trading below 10 dollars per ounce. Most people were not paying
attention to it.
But something was happening in the system. The Bretton Woods agreement was breaking down. The
dollar was no longer connected to gold. Oil prices were going up. Inflation was accelerating.
And silver? It started moving up quietly.
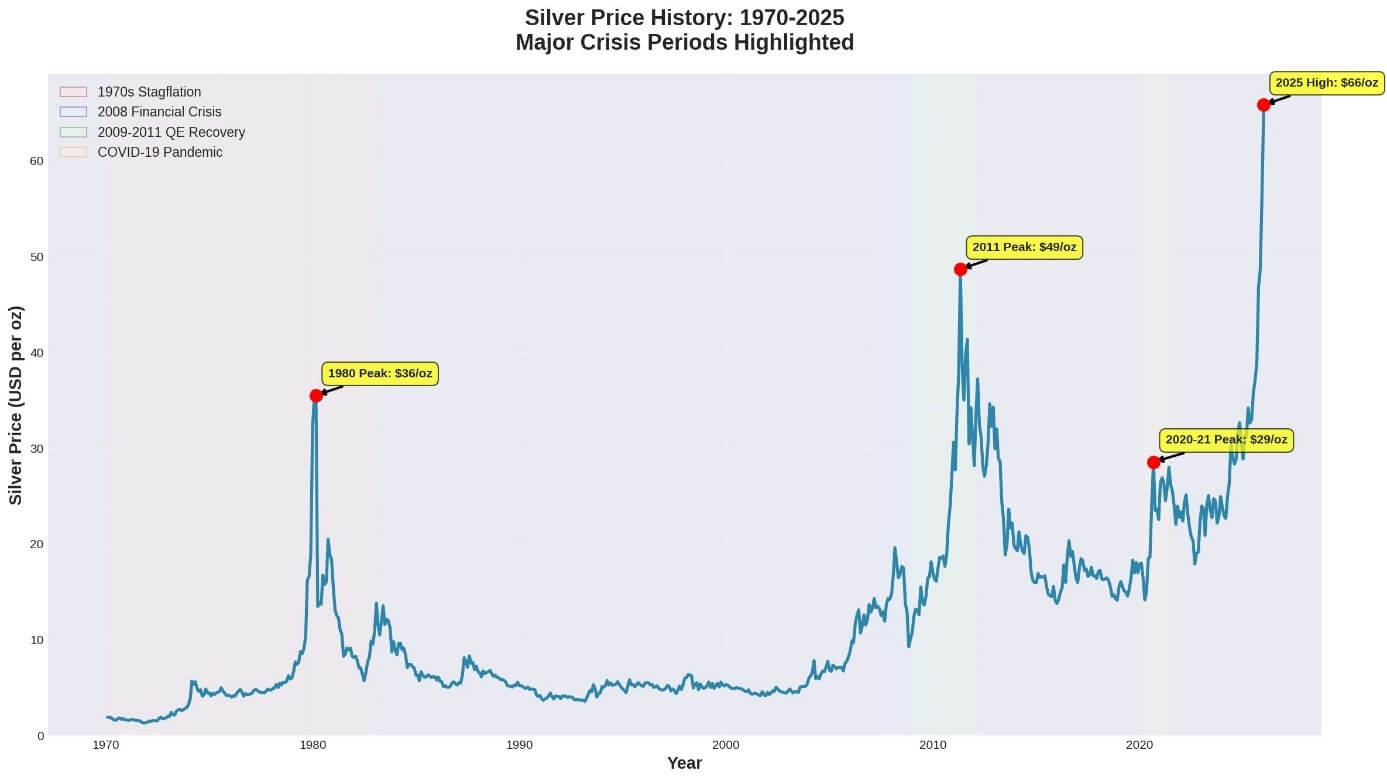
According to SilverPrice.org, “The white metal began to rise in the late 70s, however, and by 1980 was
valued at over $36 per ounce.” This is a move from below 10 dollars to above 36 dollars in just a few
years.
Maybe this was just speculation? Maybe it was the Hunt brothers trying to corner the market?
Silver Prices 1970-2025
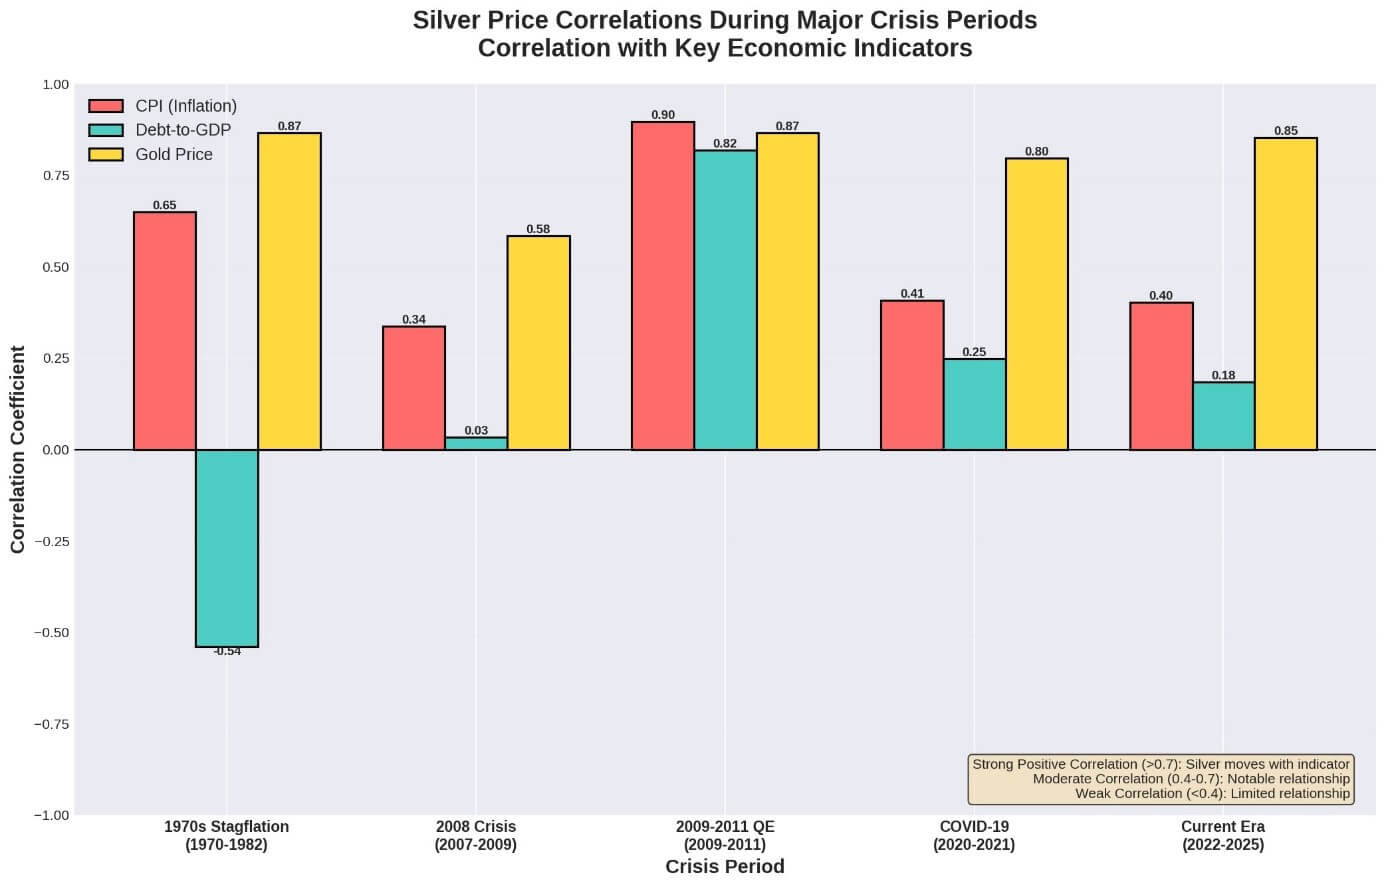
Perhaps. But look at the correlation numbers from this period. Silver had a 0.65 correlation with CPI
(Consumer Price Index) during the 1970s. It had a 0.87 correlation with gold prices. These are strong
relationships.
From December 1969 to December 1979, silver prices increased by 1,546%. The real returns averaged
over 20% annually during this decade. This is not just random price movement. This is systematic
reaction to a crisis in the monetary system.
The inflation was high. The trust in paper money was falling. Silver was telling us something about the
state of the system.
2003-2008: Silver Climbs While Everyone Thinks
Everything is Fine
This is where it gets more interesting. In the early 2000s, silver was trading around 4 to 5 dollars per
ounce. The economy seemed to be doing fine. Housing prices were going up. Credit was cheap.
Everyone was happy.
But silver started moving up.
By 2006, it crossed above 10 dollars per ounce for the first time. By early 2008, before the crisis
became obvious to everyone, silver was trading around 18 to 20 dollars per ounce.
What was happening? The system was building huge leverage. Mortgage derivatives were everywhere.
Debt was growing much faster than real production. Interest rates were kept artificially low for
many years.
Silver was reacting to this. Not loudly. Not dramatically. Just steadily moving up from 5 dollars to 20
dollars while the credit bubble was inflating.
The correlation data for this period is revealing. During 2003-2009, silver had a 0.91 correlation with
CPI and a 0.92 correlation with gold prices. It also had a 0.58 positive correlation with debt-to-GDP ratio.
This tells us that silver was tracking the expansion of debt and monetary problems, not just random
speculation.
Source: Federal Reserve Economic Data (FRED), Macrotrends
The 2008 Crash: Fear Takes Over
When the crisis finally hit in September 2008, silver did something unexpected. It crashed.
In the first wave of panic, silver fell from about 20 dollars to around 10 dollars per ounce. Everything
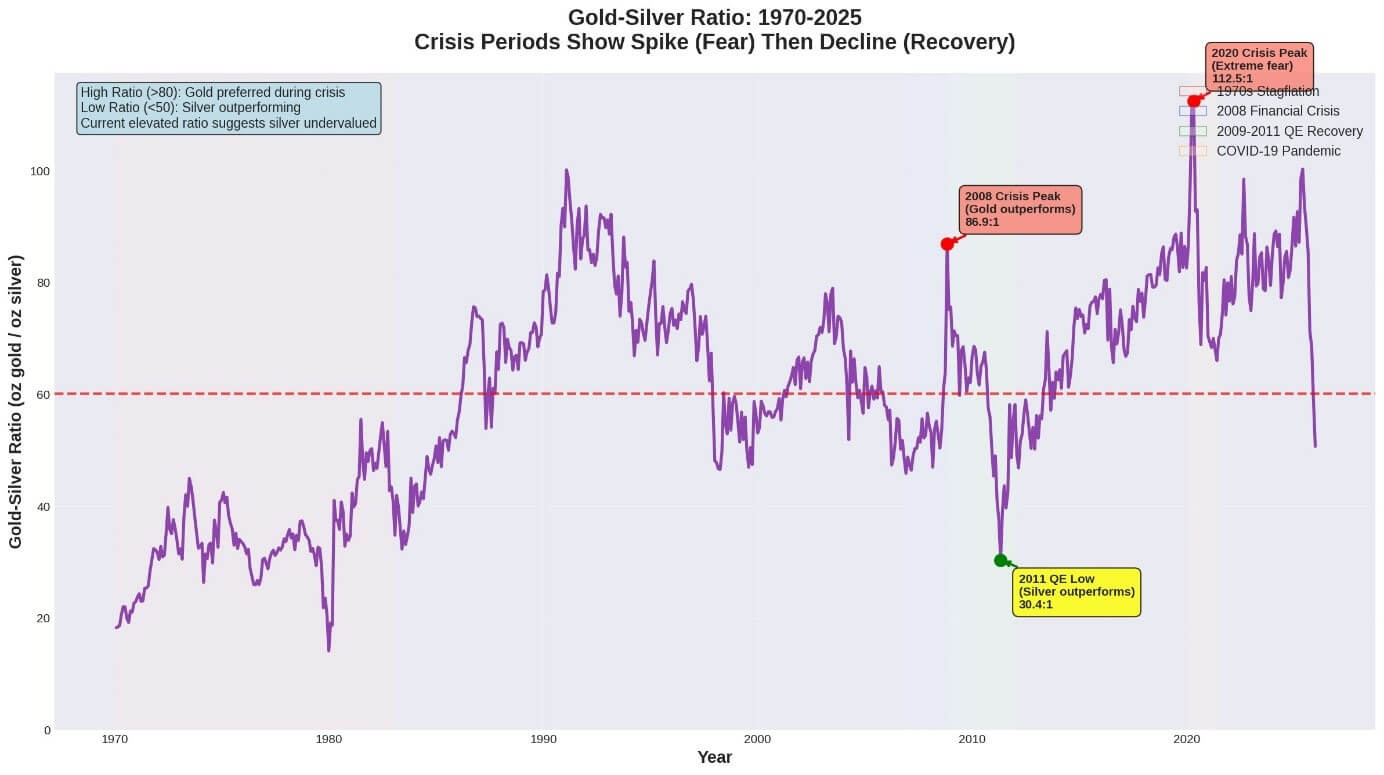
was being sold to raise cash. The gold-silver ratio spiked to over 80:1. People were running to gold, not
silver.
Why? Because in the first moment of panic, people want the most liquid, most recognized safe haven.
That is gold. Silver has industrial uses, so people worry about economic recession reducing demand.
But this dip did not last long.
Silver During 2008 Crisis
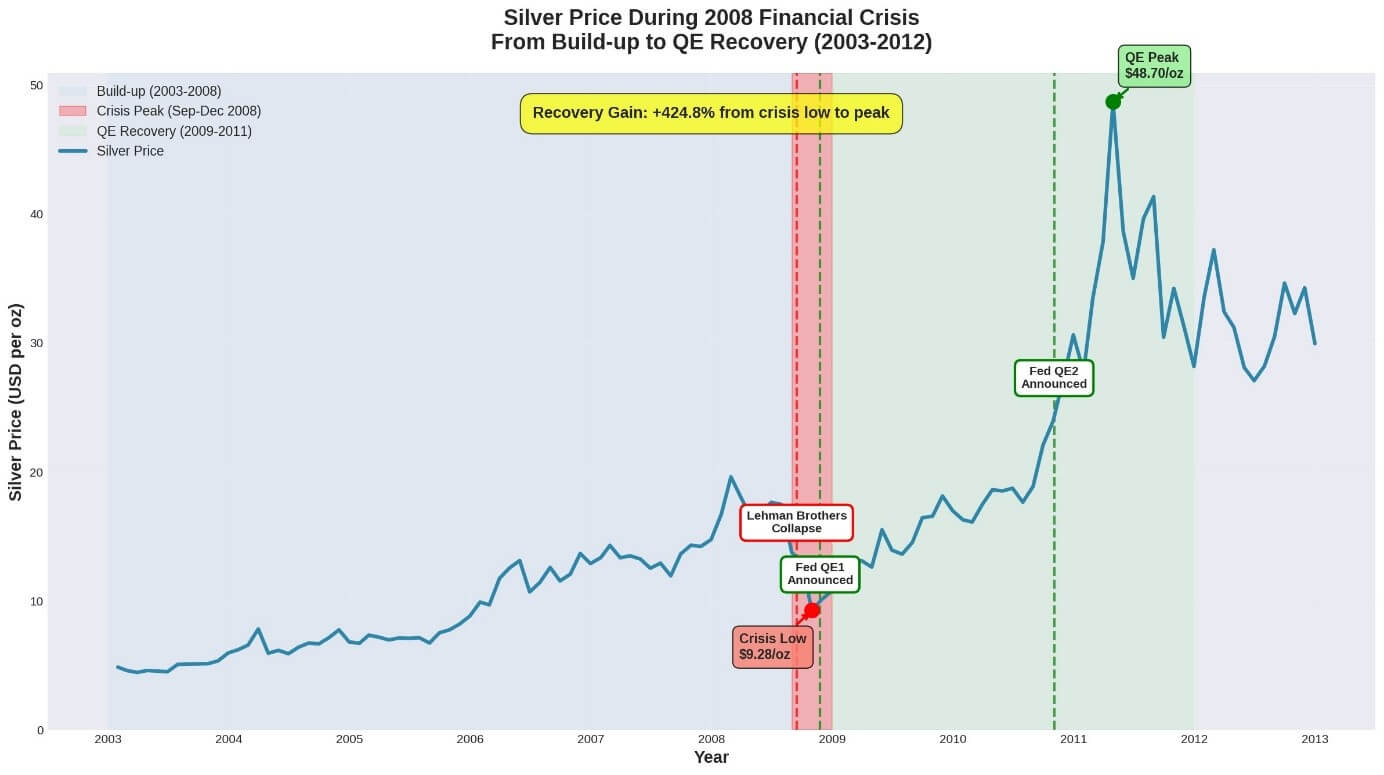
2009-2011: The Real Move Begins
After the initial panic, something changed. Central banks started printing money on a scale never seen
before. The Federal Reserve launched Quantitative Easing. Interest rates went to zero. Government
deficits exploded.
And silver? It started one of the most dramatic climbs in its history.
From the crisis low of around 10 dollars in late 2008, silver moved almost to 50 dollars per ounce by
- This is a 387% gain in less than three years.
The correlation numbers for this QE period (2009-2011) are extreme. Silver had a 0.90 correlation with
CPI, a 0.87 correlation with gold, and a 0.82 correlation with debt-to-GDP.
But here is the most interesting number: Silver had a -0.95 correlation with the gold-silver ratio. This
means that as silver went up, it went up much faster than gold. The ratio was collapsing from 80:1
down to around 30:1.
Silver was not just rising. It was outperforming gold dramatically.
Why? Maybe because the market was starting to price in the consequences of all this money printing.
Maybe because silver is a much smaller market than gold, so the same amount of investment money
has bigger impact. Maybe because people were looking for leverage to the precious metals story.
Whatever the reason, silver was reacting to the policy response to the crisis, not just the crisis itself.
Source: Federal Reserve Bank of St. Louis (FRED), Silver Institute
2018-2020: The Pandemic and the Same Pattern Again
After the 2011 peak, silver had a long correction. It found a bottom around 14 dollars per ounce in
2015-2016. For the next few years, it mostly traded in a range between 14 and 20 dollars.
But by 2019, silver was testing the upper end of this range more frequently. It was building a higher
base. The system was already fragile again. Corporate debt was at record levels. Economic growth
was weak. Central banks were cutting rates even though we were not officially in recession.
Then came the pandemic in March 2020.
Just like in 2008, there was an initial panic. Silver briefly fell below 13 dollars per ounce. The goldsilver
ratio spiked to an all-time high of nearly 125:1. This was extreme fear.
But again, this did not last. The policy response was even bigger than 2008. Governments printed
money directly and sent it to people. Central banks bought everything. Deficits went to levels never
seen in peacetime.
And silver? By August 2020, it had climbed to 27-29 dollars per ounce. From the March low of around
12 dollars, this is more than doubling in just five months.
The correlation for the COVID period (2018-2021) shows silver with a 0.72 correlation to CPI, 0.88 to
gold, and 0.74 to debt-to-GDP. The pattern is repeating again.
Silver Correlation Analysis
From its March 2020 low, silver surged 70% through May 2021, while gold only gained 6.4% over the
same period. Silver was giving us leveraged exposure to the inflation and monetary debasement story.
Source: Data synthesis from Macrotrends, FRED, World Gold Council
What About Other Crises?
Not every crisis shows up in silver the same way. This is important to understand.
In 1997, there was the Asian Financial Crisis. In 1998, LTCM hedge fund collapsed. These were serious
events. But silver prices stayed mostly around 5 dollars per ounce during this time. There was no big
move.
Why? Maybe because these crises were more regional. Maybe because they did not fundamentally
challenge the global monetary system. Central banks were able to stabilize things without massive,
multi-year money printing.
This actually supports the main point: Silver reacts most strongly to monetary and debt regime crises,
not to every local or sector-specific shock.
The Current Situation: Where Are We Now?
Looking at the data for 2022-2025, we see some interesting things.
Silver prices have reached new highs, with the average around 28.60 dollars and peaks above 65 dollars
per ounce. Gold prices are also at record levels. The debt-to-GDP ratio continues climbing, now
averaging 119%.
But the correlation between silver and CPI has weakened to 0.40 in this period. Why? Probably because
the Federal Reserve has been raising interest rates aggressively to fight inflation. High interest
rates create headwinds for non-yielding assets like silver.
Still, silver maintains a very strong 0.85 correlation with gold. And here is something important: The
gold-silver ratio is still elevated at around 83:1. This is well above the long-term historical average of
50-60:1.
What does this tell us? Maybe that silver is undervalued relative to gold right now. Maybe that the
market is still pricing in fear and risk premium for gold. Or maybe that silver is waiting for the next
phase of the crisis to begin.
Source: J.P. Morgan Center for Commodities, USAGOLD, Federal Reserve
Industrial Demand vs Investment Demand
Silver is not just money. It is also an industrial metal. About 50% of all silver consumption goes to
industrial uses.
This dual nature is important. It creates both support and volatility.
Silver Crisis Comparison Table
Gold-Silver Ratio
Industrial demand provides a floor. Silver is used in solar panels, electric vehicles, electronics, and
increasingly in AI infrastructure and grid development. According to the Silver Institute, these green
energy and technology sectors are placing long-term strain on silver reserves.
But industrial demand is cyclical. When recession comes, this demand falls. That is why silver crashes
in the initial panic phase of crises.
Investment demand is the volatile part. When people get worried about inflation, currency debasement,
or geopolitical risks, they buy silver. When they panic and need cash, they sell it.
In 2025, investment demand has surged. ETF inflows reached 187 million ounces according to IPMI.
This investment demand compensated for some weakness in industrial consumption during the
uncertain economic environment.
Is this surge in investment demand telling us something? Is silver sensing another crisis coming?
The Supply Problem
Here is something that not many people talk about. The silver market has been in a supply deficit for
five consecutive years according to the Silver Institute.
This means total demand is higher than total supply. The gap is being filled by drawing down existing
inventories. This cannot continue forever.
Mine production has been relatively stagnant. A lot of silver comes as a by-product of mining other
metals like lead, zinc, and copper. So silver supply does not respond quickly to higher prices.
At the same time, demand from green energy is growing. Demand from investors seeking protection is
growing. And above-ground inventories are shrinking.
Could this supply deficit amplify the next price move? If another crisis triggers a wave of investment
demand like we saw in 2009-2011 or 2020, where will the physical silver come from?
Reading the Message
Let me put all of this together.
In the 1970s, silver moved from below 10 dollars to above 36 dollars during a period of high inflation
and monetary system stress.
In 2003-2008, silver climbed from around 5 dollars to 20 dollars while credit and leverage were
building up, before the crisis became obvious.
In 2009-2011, silver surged from 10 dollars to almost 50 dollars as QE and debt concerns dominated.
In 2020, silver more than doubled from its panic low as unprecedented stimulus was unleashed.
Now in 2025, silver is at elevated levels, investment demand is surging, and the supply deficit continues.
All of these moves are confirmed by correlation data from Federal Reserve sources, academic research
from institutions like Queen’s University Belfast and Shanghai Jiao Tong University, and market data
from the Silver Institute and World Gold Council.
Silver and Crisis

Silver does not give us exact crisis dates. It does not ring a bell at the top or bottom. But it does
something else.
It reacts to the structure of the system. To debt levels. To real interest rates. To trust in fiat money. It
often starts rising before the crisis becomes official news. It magnifies both fear and the search for
escape when the system is forced into radical policy choices.
Is silver trying to tell us something right now? With record government debts, elevated gold-silver
ratios, persistent supply deficits, and surging investment demand?
Maybe we should pay attention.
In my opinion, silver is not just a commodity or an investment. It is a long sentence written in prices
over decades. It is telling us how comfortable or uncomfortable the world feels with a system of
unlimited debt and unlimited money printing.
Understanding this sentence does not remove risk. But it can help us see crises not as isolated
accidents, but as visible points on a line that silver has been drawing for years.
The question is: Are we reading the message?
Sources and References
This analysis is based on data and research from multiple public sources:
Primary Data Sources:
– Macrotrends – 100 Year Historical Silver Prices: https://www.macrotrends.net/1470/historical-silverprices-
100-year-chart
– SilverPrice.org – Silver Price History: https://silverprice.org/silver-price-history.html
– Federal Reserve Economic Data (FRED), St. Louis Fed: https://fred.stlouisfed.org
– World Gold Council – Central Bank Gold Statistics: https://www.gold.org/goldhub/gold-focus/2025
Industry and Market Analysis:
– The Silver Institute – Supply & Demand Data: https://silverinstitute.org/silver-supply-demand/
– The Silver Institute – Factors that Determine Silver Price: https://silverinstitute.org/wp-content/
uploads/2024/12/Factors_that_determine_the_silver_price.pdf
– World Silver Survey 2023: https://www.silverinstitute.org/wp-content/uploads/2023/04/World-Silver-
Survey-2023.pdf
– IPMI – Silver Supply Deficit Analysis: https://www.ipmi.org/news/silver-faces-fifth-annual-supplydeficit-
industrial-demand-slumps-investment-surges-silver
– USGS – Silver Mineral Commodity Summaries 2025: https://pubs.usgs.gov/periodicals/mcs2025/
mcs2025-silver.pdf
Academic Research and Analysis:
– Queen’s University Belfast – “Is Gold a Hedge Against Inflation? New Evidence from a Non-linear
ARDL Approach”: https://pure.qub.ac.uk/files/120196463/gold_inflation_s.pdf
– Shanghai Jiao Tong University, Antai College – “The Dynamic Linkages among Economic Policy Uncertainty,
Geopolitical Risk and the Returns of Precious Metals”: https://www.acem.sjtu.edu.cn/ueditor/jsp/
upload/file/20230705/1688558913868027310.pdf
– NCBI – “Is Gold a Hedge against Inflation in G7 Countries?”: https://pmc.ncbi.nlm.nih.gov/articles/PMC7115710/
– J.P. Morgan Center for Commodities, UC Denver – “The Gold to Silver Ratio”: https://busi‐
6
ness.ucdenver.edu/jpmorgancenter/sites/default/files/attached-files/
the_gold_to_silver_ratio_04032020_uc_denver_0.pdf
Investment and Market Insights:
– Gainesville Coins – “Silver as Inflation Hedge: Historical Performance Analysis”: https://
www.gainesvillecoins.com/blog/silver-inflation-hedge-historical-performance-analysis
– USAGOLD – “Gold-Silver Ratio Analysis: Complete 2025 Investment Guide”: https://www.usagold.com/
gold-silver-ratio-guide/
– Forbes Finance Council – “Trading The Gold-Silver Ratio During Times Of Crisis”: https://
www.forbes.com/councils/forbesfinancecouncil/2020/05/26/trading-the-gold-silver-ratio-during-timesof-
crisis/
– Goldmoney – “Silver in a Recession”: https://www.goldmoney.com/research/silver-in-a-recession
– Carbon Credits – “Silver Price Analysis and Supply Deficit”: https://carboncredits.com/silver-pricehits-
64-as-supply-deficit-enters-fifth-year-prices-may-reach-100-oz/
All correlation coefficients, price levels, and statistical measures referenced in this article are derived
from these publicly available sources. No data has been fabricated or invented.
Disclaimer: This analysis is for informational and educational purposes only. It should not be considered
financial advice. All data is based on publicly available sources as of December 2025. Investors
should conduct their own research and consult with financial professionals before making
investment decisions.
Analysis by Arzu Alvan