
Analysis of economic cycles in the historical process allows us to make predictions about what is coming. We can use various indicators for this analysis. One of these is the cycles of large-volume stock markets in the last 20-30 years. For example DowJones or S & P500 are two of them. If we look at the graph below we will have an idea about the loops. In the chart, we see the values of the S & P500 and DowJones exchanges between 2000-2021. From mid-2003, right after the 2000 Dot.com crisis
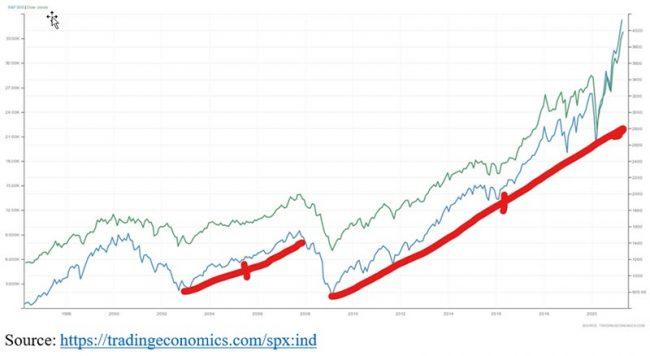
In the 5-year period up to the 2008 real estate crisis, it gained an average of 280 units of value each year. After the 2008 crisis, it has increased by an average of 254 units every year from 2009 until March 2020 (13 March 2020, the first wave of the crisis), with an almost parallel increase. Monthly increments are up to 26 units. This suggests that a second wave may come at the end of April or early May. Monetary authorities, especially the FED, who see this situation, are also doing QE for precautionary purposes. This may only delay the process a little longer, but it cannot prevent the inevitable.